IME's Community First Presented FVGsIME's Community First Presented FVGs v1.5 - Advanced Implementation
ORIGINALITY & INNOVATION
This indicator advances beyond basic Fair Value Gap detection by implementing a sophisticated 24-hour FVG lifecycle management system aligned with institutional trading patterns. While many FVG indicators simply detect gaps and extend them indefinitely, this implementation introduces temporal intelligence that mirrors how institutional algorithms actually manage these inefficiencies.
Key Innovations that set this apart:
- 24-Hour Lifecycle Management: FVGs extend dynamically until 16:59, then freeze until removal at 17:00 next day
- Institutional Day Alignment: Recognizes 18:00-16:59 trading cycles vs standard calendar days
- Multi-Session Detection: Simultaneous monitoring of Midnight, London, NY AM, and NY PM sessions
- Advanced Classification System: A.FVG detection with volume imbalance analysis vs classic FVG patterns
- Volatility Settlement Logic: Blocks contamination from opening mechanics (3:01+, 0:01+, 13:31+ rules)
- Visual Enhancement System: C.E. lines, contamination warnings, dark mode support with proper transparency handling
BASED ON ICT CONCEPTS
This indicator implements First Presented Fair Value Gap methodology taught by ICT (Inner Circle Trader). The original F.P. FVG concepts, timing rules, and session-based detection are credited to ICT's educational material. This implementation extends those foundational concepts with advanced lifecycle management and institutional alignment features.
ICT's Core F.P. FVG Rules Implemented:
- First clean FVG after session opening (avoids opening contamination)
- 3-candle pattern requirement for valid detection
- Session-specific timing windows and volatility settlement
- Consequent Encroachment level identification
IME's Advanced Enhancements:
- Automated lifecycle management with institutional day recognition
- Multi-session simultaneous monitoring with proper isolation
- Advanced visual system with transparency states for aged FVGs
- A.FVG classification with volume imbalance detection algorithms
HOW IT WORKS
Core Detection Engine
The indicator monitors four key institutional sessions using precise timing windows:
- Midnight Session: 00:01-00:30 (blocks 00:00 contamination)
- London Session: 03:01-03:30 (blocks 03:00 contamination)
- NY AM Session: 09:30-10:00 (configurable 9:30 detection)
- NY PM Session: 13:31-14:00 (blocks 13:30 contamination)
During each session window, the algorithm scans for the first valid FVG pattern using ICT's 3-candle rule while applying volatility settlement principles to avoid false signals from opening mechanics.
Advanced Classification System
Classic FVG Detection:
Standard 3-candle wick-to-wick gap where candle 1 and 3 don't overlap, creating an inefficiency that institutions must eventually fill.
A.FVG (Advanced FVG) Detection:
Enhanced pattern recognition that includes volume imbalance analysis (deadpool detection) to identify more significant institutional inefficiencies. A.FVGs incorporate both the basic gap plus additional price imbalances between candle bodies, creating larger, more significant levels.
24-Hour Lifecycle Management
Phase 1 - Dynamic Extension (Creation Day):
From detection until 16:59 of creation day, FVGs extend in real-time as new bars form, maintaining their relevance as potential support/resistance levels.
Phase 2 - Freeze Period (Next Day):
At 16:59, FVGs stop extending and "freeze" at their final size, remaining visible as reference levels but no longer growing. This prevents outdated levels from contaminating fresh analysis.
Phase 3 - Cleanup (17:00 Next Day):
Exactly 24+ hours after creation, FVGs are automatically removed to maintain chart clarity. This timing aligns with institutional trading cycle completion.
Institutional Day Logic
The algorithm recognizes that institutional trading days run from 18:00-16:59 (not midnight-midnight). This alignment ensures FVGs are managed according to institutional timeframes rather than arbitrary calendar boundaries.
Contamination Avoidance System
Volatility Settlement Principle:
Opening mechanics create artificial volatility that can produce false FVG signals. The indicator automatically blocks detection during exact session opening times (X:00) and requires settlement time (X:01+) before identifying clean institutional inefficiencies.
Special NY AM Handling:
Provides configurable 9:30 detection for advanced users who want to capture potential opening range FVGs, with clear visual warnings about contamination risk.
VISUAL SYSTEM
Color Intelligence
- Current Day FVGs: Full opacity with session-specific colors
- Previous Day FVGs: 70% transparency for historical reference
- Special Timing (9:30): Dedicated warning color with alert labels
- Dark Mode Support: Automatic text/line color adaptation
Enhanced Visual Elements
C.E. (Consequent Encroachment) Lines:
Automatically calculated 50% levels within each FVG, representing the most likely fill point based on institutional behavior patterns. These levels extend and freeze with their parent FVG.
Contamination Warnings:
Visual alerts when FVGs are detected during potentially contaminated timing, helping traders understand signal quality.
Session Identification:
Clear labeling system showing FVG type (FVG/A.FVG), session origin (NY AM, London, etc.), and creation date for easy reference.
HOW TO USE
Basic Setup
1. Session Selection: Enable/disable specific sessions based on your trading strategy
2. FVG Type: Choose between Classic FVGs or A.FVGs depending on your analysis preference
3. Visual Preferences: Adjust colors, text size, and enable dark mode if needed
Trading Applications
Intraday Reference Levels:
Use current day FVGs as potential support/resistance for price action analysis. The dynamic extension ensures levels remain relevant throughout the trading session.
Multi-Session Analysis:
Monitor how price interacts with FVGs from different sessions to understand institutional flow and market structure.
C.E. Level Trading:
Focus on the 50% consequent encroachment levels for high-probability entry points when price approaches FVG zones.
Historical Context:
Previous day FVGs (shown with transparency) provide context for understanding market structure evolution across multiple trading days.
Advanced Features
9:30 Special Detection:
For experienced traders, enable 9:30 FVG detection to capture opening range inefficiencies, but understand the contamination risks indicated by warning labels.
A.FVG vs Classic Toggle:
Switch between detection modes based on market conditions - A.FVGs for trending environments, Classic FVGs for ranging conditions.
Best Practices
- Use on 1-minute to 15-minute timeframes for optimal session detection
- Combine with other institutional concepts (order blocks, liquidity levels) for comprehensive analysis
- Pay attention to transparency states - current day FVGs are more actionable than previous day references
- Consider C.E. levels as primary targets rather than full FVG fills
TECHNICAL SPECIFICATIONS
Platform: Pine Script v6 for optimal performance and reliability
Timeframe Compatibility: All timeframes (optimized for 1M-15M)
Market Compatibility: 24-hour markets (Forex, Crypto, Futures)
Session Management: Automatic trading day detection with weekend handling
Memory Management: Intelligent capacity limits with automatic cleanup
Performance: Optimized algorithms for smooth real-time operation
CLOSED SOURCE JUSTIFICATION
This indicator is published as closed source to protect the proprietary algorithms that enable:
- Precise 24-hour lifecycle timing calculations with institutional day alignment
- Advanced A.FVG classification with sophisticated volume imbalance detection
- Complex multi-session coordination with contamination filtering
- Optimized memory management preventing performance degradation
- Specialized visual state management for transparency and extension logic
The combination of these advanced systems creates a unique implementation that goes far beyond basic FVG detection, warranting protection of the underlying computational methods while providing full transparency about functionality and usage.
PERFORMANCE CHARACTERISTICS
Real-Time Operation: Smooth performance with minimal resource usage
Accuracy: Precise session detection with timezone consistency
Reliability: Robust error handling and edge case management
Scalability: Supports multiple simultaneous FVGs without performance impact
This advanced implementation represents significant evolution beyond basic FVG indicators, providing institutional-grade analysis tools for serious traders while maintaining the clean visual presentation essential for effective technical analysis.
IMPORTANT DISCLAIMERS
Past performance does not guarantee future results. This indicator is an educational tool based on ICT's Fair Value Gap concepts and should be used as part of a comprehensive trading strategy. Users should understand the risks involved in trading and consider their risk tolerance before making trading decisions. The indicator identifies potential support/resistance levels but does not predict market direction with certainty.
2 days ago
Release Notes
IME's Community First Presented FVGs v1.5.2 - Critical Bug Fixes
Bug Fixes:
v1.5.1 - Fixed 9:30 Contamination Blocking:
Issue: When 9:30 detection toggle was OFF, script still detected 9:30 candles as F.P. FVGs
Fix: Added proper contamination blocking logic that prevents 9:30 middle candle detection when toggle is OFF
Result: Toggle OFF now correctly shows clean F.P. FVGs at 9:31+ (proper ICT volatility settlement)
v1.5.2 - Fixed A.FVG Box Calculation Accuracy:
Issue: A.FVG boxes incorrectly included ALL body levels even when no actual deadpool existed between specific candles
Fix: Implemented selective body level inclusion - only adds body prices where actual volume imbalances exist
Result: A.FVG boxes now accurately represent only areas with real institutional volume imbalances
Impact:
More Accurate Detection: 9:30 contamination properly blocked when disabled
Precise A.FVG Zones: Boxes only include levels with actual deadpools/volume imbalances
Institutional Accuracy: Both fixes align detection with true institutional trading principles
Technical Details:
Enhanced contamination blocking checks middle candle timing in normal mode
A.FVG calculation now selectively includes body levels based on individual deadpool existence
Maintains backward compatibility with all existing features and settings
These fixes ensure the indicator provides institutionally accurate FVG detection and sizing for professional trading analysis.
חפש סקריפטים עבור "order block"

tabbys star [Algo Seeker]Tabbys Star Mission:
Identifying key supply and demand areas for entries, identifying trends for holding positions, and locating potential re-entry or exit points is incredibly useful for traders and investors. This algorithm is designed to simplify these critical processes by providing actionable and intuitive tools directly on the chart.
🟢 Supply & Demand Zones (S&D)
The algorithm identifies key entry points by creating supply and demand blocks that automatically expand across the chart. These blocks remain active until invalidated, helping traders maintain awareness of significant price levels. When a new pivot point is identified, the algorithm generates a new supply or demand block that starts expanding from that pivot. This functionality enables traders to monitor evolving zones while referencing older ones, which might still act as weaker pivot points. These areas are incredibly unique and useful for traders, as they dynamically adapt to price action and provide clear visual cues for decision-making.
🟢 Continuation and Exit Signals
The algorithm also highlights areas for potential re-entries or exits. When the price moves beyond a supply or demand block, arrows are displayed to signal that this area may now be optimal for re-entering a trade or exiting a position.
Separating this logic from supply and demand zones offers significant flexibility for traders. For example, those who wish to hold positions initiated at an order block can confidently wait for these signals before taking profits. Similarly, traders who missed the initial opportunity at an order block can use these signals to evaluate new trade opportunities. This feature is incredibly useful for adapting to evolving market conditions.
🟩 Important Note
Arrow/triangle signals are not definitive indicators of upward or downward movement; they serve as calls to attention. These signals should be analyzed in conjunction with supply and demand zones.
For example, if a signal suggests bullish movement but the price falls below the current supply or demand zone, the signal was merely a call to attention. In such cases, it may indicate the need to set a stop loss or even consider a bearish trade below the zone.
Signals should be viewed as one of several factors to consider and should never be traded on in isolation.
🟢 Trendlines for Additional Confluence
In addition to supply and demand zones, the algorithm generates trendlines to help traders better visualize market trends. These trend lines are drawn from pivot points within the supply and demand blocks, providing an additional layer of confluence. For traders who rely on trendline breaks to make decisions, this feature enhances the overall analysis and adds value to the trading strategy.
🟢 Candle Color Coding
To further enhance clarity, the algorithm color-codes candles based on their position relative to the most recent order block:
Bullish: When the price is above the most recent order block.
Neutral: When the price is within the order block.
Bearish: When the price is below the order block.
This color-coding offers a unique and useful visual representation of the current market sentiment, allowing traders to assess price action at a glance.
Settings Overview
🟢Calculation Strength
This setting allows the user to choose how strict the algorithm should be when calculating data. The Standard option generates more entry and exit signals because the calculations are more lenient.. The Restrictive option uses stricter calculations, resulting in fewer signals for entries and exits.
🟢Use Current Bar:
If checked, the conditions will act on the current bar (real-time updates). If unchecked, the conditions will act after the bar closes. For a non-repainting indicator, leave this unchecked.
🟢Session Type:
Both:
Includes market and after-market hours.
RTH:
Regular trading hours only.
🟢Max Trend Lines:
"1": No trend lines will be shown.
"2" or higher: Displays trend lines based on pivot points.
🟢Bar Color:
Allows selection of candle colors based on the parameters discussed above.
🟢Signal Colors:
As described earlier.
🟢Alerts
For when a signal is created.
Conclusion
This tool is designed to hopefully assist investors and traders by:
Identifying key supply and demand areas for entries.
Highlighting trends for holding positions.
Pinpointing potential re-entry or exit points.

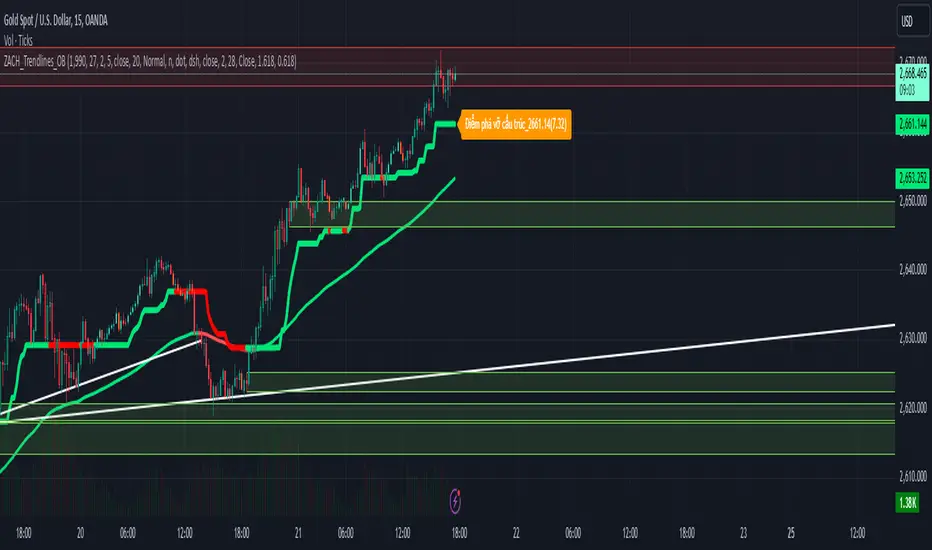
ZACH_Trendlines_OBThe Pine Script you've shared appears to be a comprehensive indicator that combines various strategies and tools for technical analysis in TradingView. It includes functionalities such as:
Trendlines (Support/Resistance):
The script calculates pivot points and draws trendlines connecting them.
Implements both bullish and bearish trendlines with customizable styles, colors, and extensions.
Magic Trend (ATR-based):
Plots a trendline derived from ATR (Average True Range) and CCI (Commodity Channel Index) to identify trend directions.
Order Blocks (OB):
Identifies bullish and bearish order blocks based on price momentum and sensitivity settings.
Order blocks are drawn as rectangles and extended in the chart with configurable border and background colors.
Uses ROC (Rate of Change) to identify key price levels where order blocks might form.
Alerts:
Includes alert conditions for breakouts and interactions with order blocks.
Customizable Inputs:
Allows users to modify key parameters such as ATR period, CCI period, pivot length, and sensitivity for order blocks.
Key Features Summary:
Trendlines:
Bullish/Bearish trendlines with detection for breakout points.
Option to enable/disable upper/lower lines and extend them.
Magic Trend:
Visualizes directional trends using ATR and CCI.
Order Blocks:
Detection and plotting of order blocks based on momentum.
Configurable OB mitigation type (Close or Wick).
Alerts:
Triggers alerts for specific events (e.g., order block breaches).
Suggestions for Further Refinements:
Performance Optimization:
The nested loops, especially in order block creation, might impact performance on larger datasets or lower timeframes. Consider optimizing these for better responsiveness.
Commenting and Documentation:
Add comments to describe the purpose and logic behind each section to make the script more maintainable.
Validation:
Check for edge cases (e.g., when there are insufficient data points for pivot calculation).
If you'd like assistance debugging specific parts of this script or optimizing any component, feel free to point it out!
ICT KillZones Hunt [TradingFinder] 4 Sessions + OB + FVG + Alert🔵 Introduction
🟣 ICT
The "ICT" style is a subset of "Price Action" technical analysis. The primary goal of the ICT trading strategy is to merge "Price Action" with the "Smart Money" concept to pinpoint optimal trade entry points.
However, this approach's strength extends beyond merely finding entry points. It also helps traders gain a deeper understanding of price behavior and adapt their trading strategies to the market structure.
The most important concepts of "ICT" :
Order Block
Fair Value Gap(FVG)
Liquidity
🟣 Session
Financial markets are divided into several time periods, each featuring distinct characteristics and levels of activity. These periods, known as sessions, are active at different times during the day.
The primary active sessions in financial markets include :
Asian Session
European Session
New York Session
Based on the UTC time zone, the schedule for these key sessions is :
Asian Session: 23:00 to 06:00
European Session: 07:00 to 16:30
New York Session: 13:00 to 22:00
Note
To avoid session overlap and minimize interference during kill zones, the session times have been modified as follows :
Asian Session: 23:00 to 06:00
European Session: 07:00 to 14:25
New York Session: 14:30 to 22:55
🟣 KillZone
Kill zones are periods within a session where trader activity spikes. During these times, trading volume surges, and price movements become more pronounced.
The major kill zones, according to the UTC time zone, are as follows :
Asian Kill Zone: 23:00 to 03:55
European Kill Zone: 07:00 to 09:55
New York Morning Kill Zone: 14:30 to 16:55
New York Evening Kill Zone: 19:30 to 20:55
🔵 How to Use
🟣 Order Block
Order blocks are a distinct category of "Supply and Demand" zones, formed when a series of orders are grouped together. These blocks are often created by banks or other significant market participants.
Banks typically execute large orders in blocks during their trading sessions. If they were to enter the market with small quantities, substantial price movements would occur before the orders were fully executed, reducing potential profit.
To mitigate this, they divide their orders into smaller, more manageable positions. Traders should seek "buy" opportunities in "demand order blocks" and "sell" opportunities in "supply order blocks."
🟣 Fair Value Gap (FVG)
To pinpoint the "Fair Value Gap" on the chart, meticulous candle-by-candle analysis is essential. Pay close attention to candles with significant bodies, examining each candle alongside the one preceding it.
The candles flanking this central candle should exhibit elongated shadows, with bodies that do not intersect the body of the central candle. The span between the shadows of the first and third candles is referred to as the FVG range.
Note :
The origin of all Order Blocks and FVGs starts from inside a kill zone and extends up to the end of the same session.
🟣 Kill Zone Hunt
Following this strategy, after the conclusion of the kill zone and the stabilization of its high and low lines, if the price touches either of these lines within the same session and encounters a robust rejection, it presents an opportunity to enter a trade.
🔵 Setting
🟣 Global Setting
Show All Order Block :
If it is turned off, only the last Order Block will be displayed.
Show All FVG :
If it is turned off, only the last FVG will be displayed.
Show More Info Session :
If it is turned on, more information about kill zones (Trade Volume, Time, Number of Candles) will be displayed.
🟣 Logic Parameter
Pivot Period of Order Blocks Detector :
Enter the desired pivot period to identify the Order Block.
Order Block Validity Period (Bar) :
You can specify the maximum time the Order Block remains valid based on the number of candles from the origin.
Mitigation Level Order Block :
Determining the basic level of a block order. When the price hits the basic level, the order block due to mitigation.
🟣 Order Blocks Display
Demand Order Block :
Show or not show and specify color.
Supply order Block :
Show or not show and specify color.
🟣 Order Block Refinement
Refine Demand OB :
Enable or disable the refinement feature. Mode selection.
Refine Supply OB :
Enable or disable the refinement feature. Mode selection.
🟣 FVG
FVG Validity Period (Bar) :
You can specify the maximum time the FVG remains valid based on the number of candles from the origin.
Mitigation Level FVG :
Determining the basic level of a FVG. When the price hits the basic level, the FVG due to mitigation.
Show Demand FVG :
Show or not show and specify color.
Show Supply FVG :
Show or not show and specify color.
FVG Filter :
Enable or disable filtering of FVGs. Select filter mode.
🟣 Session
Show More Info Session Color
Asia Session, London Sesseion, New York am Session & New York pm Session :
Show or not show session and kill zones. Change the display color.
🟣 Alert
Send Alert When Touched Session high & Low :
On / Off
Alert Demand OB Mitigation :
On / Off
Alert Supply OB Mitigation :
On / Off
Alert Demand FVG Mitigation :
On / Off
Alert Supply FVG Mitigation :
On / Off
Message Frequency :
This string parameter defines the announcement frequency. Choices include: "All" (activates the alert every time the function is called), "Once Per Bar" (activates the alert only on the first call within the bar), and "Once Per Bar Close" (the alert is activated only by a call at the last script execution of the real-time bar upon closing). The default setting is "Once per Bar".
Show Alert Time by Time Zone :
The date, hour, and minute you receive in alert messages can be based on any time zone you choose. For example, if you want New York time, you should enter "UTC-4". This input is set to the time zone "UTC" by default.
Display More Info :
Displays information about the price range of the order blocks (Zone Price) and the date, hour, and minute under "Display More Info". If you do not want this information to appear in the received message along with the alert, you should set it to "Off".

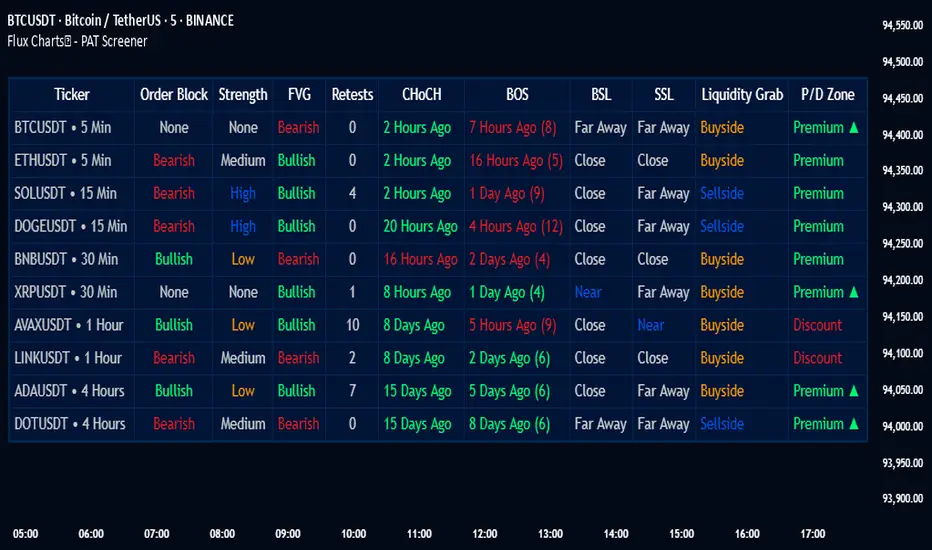
PAT Screener | Flux Charts💎 GENERAL OVERVIEW
Introducing our new Price Action Toolkit (PAT) Screener! This screener can spot trading opportunities that Price Action Toolkit offers across 8 different tickers! We believe that this screener will help you take a glimpse of the current state of the market much easier.
Features of the new Price Action Toolkit (PAT) Screener :
Finds Latest Across 8 Tickers:
Order Blocks
Breaker Blocks
Fair Value Gaps (FVG)
Inversion FVGs
Market Structures (BOS, CHoCH, CHoCH+)
Liquidity Zones
Liquidity Grabs
Premium / Discount Zones
Shows Additional Information Like :
Strength
Retests
(Bullish & Bearish) Volume
Consumption
Also :
All Features Support Tuning
Customizable Theme
📌 HOW DOES IT WORK ?
1. Order Blocks
Order blocks occur when there is a high amount of market orders exist on a price range. It is possible to find order blocks using specific formations on the chart.
The high & low volume of order blocks should be taken into consideration while determining their strengths. The determination of the high & low volume of order blocks are similar to FVGs, in a bullish order block, the high volume is the last 2 bars' total volume, while the low volume is the oldest bar's volume. In a bearish order block scenario, the low volume becomes the last 2 bars' total volume.
2. Breaker Blocks
Breaker blocks form when an order block fails, or "breaks". It is often associated with market going in the opposite direction of the broken order block, and they can be spotted by following order blocks and finding the point they get broken, i.e. price goes below a bullish order block.
The volume of a breaker block is simply the total volume of the bar that the original order block is broken. Often the higher the breaking bar's volume, the stronger the breaker block is.
The strength of Order & Breaker Blocks are calculated by the size of the block to the Average True Range (ATR) of the chart.
3. Fair Value Gaps
Fair value gaps often occur when there is an imbalance in the market, and can be spotted with a specific formation on the chart.
The volume when the FVG occurs plays an important role when determining the strength of it, so we've placed two bars on the FVG zone, indicating the high & low volumes of the FVG. The high volume is the total volume of the last two bars on a bullish FVG, while the low volume is - of the FVG. For a bearish FVG, the total volume of the last two bars is the low volume. The indicator can also detect FVGs that exist in other timeframes than the current chart.
4. Inversion Fair Value Gaps
A Fair Value Gap generally occur when there is an imbalance in the market. They can be detected by specific formations within the chart. An Inverse Fair Value Gap is when a FVG becomes invalidated, thus reversing the direction of the FVG.
IFVGs get consumed when a Close / Wick enters the IFVG zone. Check this example:
5. Market Structures
Sometimes specific market structures form and break as the market fills buy & sell orders. Formed Change of Character (CHoCH) and Break of Structure (BOS) often mean that market will change direction, and they can be spotted by inspecting low & high pivot points of the chart.
The number of times the chart recently had a BOS is displayed between brackets, Ex : (3)
6. Liquidity Zones
Buyside & Sellside Liquidity zones are where most traders place their take-profits and stop-losses in their long / short positions. They are spotted by using high & low pivot points on the chart.
7. Liquidity Grabs
Liquidity grabs occur when one of the latest pivots has a false breakout. Then, if the wick to body ratio of the bar is higher than 0.5 (can be changed from the settings) a liquidity grab has occurred.
8. Premium & Discount Zones
The premium zone is a zone that is over the fair value of the asset's price, and the discount zone is the opposite. They are formed by the latest high & low pivot points.
If the latest close price is outside the Premium or Discount zone, you will see "Premium ⬆️" or "Discount ⬇️". These mean that the price is currently higher than the premium zone or lower than the discount zone.
🚩UNIQUENESS
This screener offers a comprehensive dashboard for traders, combining multiple analytical elements with customizable settings to aid in decision-making across different tickers and timeframes. We believe that this will help traders spot trading opportunities much easier by providing crucial information in a single dashboard. Our new screener contains of common elements like Order & Breaker Blocks, Fair Value Gaps & IFVGs as well as rather unique elements like Liquidity Grabs . With the use of up to 8 tickers & timeframes , you can easily take a look at the bigger picture of the market. We recommend reading the "How Does It Work" section of the description to get a better understanding about how this indicator is unique to others.
⚙️SETTINGS
1. Tickers
You can set up to 8 tickers for the screener to scan here. You can also enable / disable them and set their individual timeframes.
You can enable / disable Retests, Strength, Consumption and (Bullish & Bearish) Volume for :
Order Blocks (Retests, Strength, Bullish & Bearish Volume)
Breaker Blocks (Retests, Strength, Volume)
Fair Value Gaps (Retests, Consumption, Strength, Bullish & Bearish Volume)
Inversion Fair Value Gaps (Retests, Consumption, Strength, Volume)
2. Order Blocks
Enabled -> Enables / Disables Order Blocks
Zone Invalidation -> Select between Wick & Close price for Order Block Invalidation.
Swing Length -> Swing length is used when finding order block formations. Smaller values will result in finding smaller order blocks.
3. Breaker Blocks
Enabled -> Enables / Disables Breaker Blocks
Zone Invalidation -> Select between Wick & Close price for Breaker Block Invalidation.
4. Fair Value Gaps
Enabled -> Enables / Disables Fair Value Gaps
Zone Invalidation -> Select between Wick & Close price for FVG Zone Invalidation.
Zone Filtering -> With "Average Range" selected, algorithm will find FVG zones in comparison with average range of last bars in the chart. With the "Volume Threshold" option, you may select a Volume Threshold % to spot FVGs with a larger total volume than average.
FVG Detection -> With the "Same Type" option, all 3 bars that formed the FVG should be the same type. (Bullish / Bearish). If the "All" option is selected, bar types may vary between Bullish / Bearish.
Detection Sensitivity -> You may select between Low, Normal or High FVG detection sensitivity. This will essentially determine the size of the spotted FVGs, with lower sensitivities resulting in spotting bigger FVGs, and higher sensitivities resulting in spotting all sizes of FVGs.
5. Inversion Fair Value Gaps
Zone Invalidation -> Select between Wick & Close price for IFVG Zone Invalidation. This setting also switches the type for IFVG consumption.
6. Market Structures
Break Of Structure (BOS) -> If the current structure of the market is broken in a bullish or bearish direction, it will be displayed.
Change Of Character (CHoCH) -> If the market shifts into another direction, it will be displayed.
Change Of Character+ (CHoCH+) -> This will display Change Of Characters detected with higher sensitivity if enabled.
7. Liquidity Zones
Buyside Liquidity -> Enables / Disables Buyside Liquidity
Sellside Liquidity -> Enables / Disables Sellside Liquidity
8. Liquidity Grabs
Pivot Length -> This setting determines the range of the pivots. This means a candle has to have the highest / lowest wick of the previous X bars and the next X bars to become a high / low pivot.
Wick-Body Ratio -> After a pivot has a false breakout, the wick-body ratio of the latest candle is tested. The resulting ratio must be higher than this setting for it to be considered as a liquidity grab.
9. Premium & Discount Zones
Enabled -> Enables / Disables Premium & Discount Zones.
10. Style
You can customize the visual looks of the screener here.
[AlbaTherium] MTF Internal Ranges Analysis - IRA-Phoenix for SMCIntroduction:
The MTF Internal Ranges Analysis - IRA - Phoenix acts as an extension to the original main SMC Indicator by AlbaTherium . This add-on provides insights into multi-timeframe internal structure points, swing structure points, POIs (Points of Interest), and order blocks (OB). By integrating this enhancement, your multi-timeframe analyses become more streamlined, expediting the process and minimizing chart workload .
This tool represents an advanced smart money technical analysis aimed at enhancing your trading experience. It introduces four pivotal concepts:
Main Features:
Multiple Timeframes and Confluences,
SCOB Internal Order Block.
Demand to Supply (D2S) or Supply to Demand (S2D) across Multiple timeframes
SCOB on LTF and SCM on HTF across same Candle
By combining these concepts all in one, traders can find confluences zones across multiple timeframes and gain a comprehensive understanding of market dynamics, theses confluences zones empower order block skills and potentiality, showcasing them as essential, crucial, powerful, strategic, and pivotal, one of the pillars in smart money concepts trading strategy to make more informed decisions.
Settings Overview:
Select timeframe {Select or current chart}
Inside bar ranges
Internal structure as Internal zigzag {turn on/ off / unconfirmed(live) zigzag}
Single Candle Mitigation Pattern {turn on/ off / confirmed / unconfirmed}
Single Candle Order Block Pattern {turn on/ off / confirmed / unconfirmed}
Demands and Supplies (D&S) {turn on/ off / confirmed / unconfirmed}
OB Mitigation {touch/ extended}
Understanding the Features:
Chapter 1: Multiple Timeframes and Confluences
Our Multi-timeframe analysis approach enables traders to analyze market trends and volatility across different timeframes. Confluences, where signals align across multiple timeframes, provide strong indications for trading opportunities.
Practical Example:
- With MTF IRA - Phoenix , traders can seamlessly transition between different timeframes while maintaining a cohesive analysis. For instance, traders can monitor the M15, H1, or M5 charts while focusing on entry on the M1 timeframe, enabling a holistic view of market trends and opportunities .
Chapter 2: SCOB Internal Order Block across Multiple Timeframe
SCOB Internal Order Block (SCOB IOB) highlights critical zones in price action, showcasing the dominance of aggressive buyers or sellers on orders blocks. As confluences accumulate across multiple timeframes, the strength of the order block intensifies, presenting entry opportunities.
Practical Example:
You have the ability to detect zones where price ranges have formed; these areas are highly sought after for taking buying as well as selling positions, especially when these areas are reflected across 1 or 3 timeframes.
The only practical way to see theses confluences is to use this Indicator, see the example below
Chapter 03: Demand to Supply (D2S) or Supply to Demand (S2D) across Multiple timeframes
The Demand to Supply or Supply to Demand feature within MTF Internal Ranges Analysis - IRA - Phoenix offers a nuanced analysis of price action dynamics across various timeframes. By identifying shifts in supply and demand zones, traders gain valuable insights into market sentiment and potential price reversals.
This feature enables traders to anticipate changes in market direction by recognizing the interplay between demand and supply across different timeframes. By understanding how price reacts at key support and resistance levels, traders can make informed decisions and capitalize on emerging trends.
The Demand to Supply or Supply to Demand feature enhances the indicator's usefulness by providing traders with actionable information to navigate complex market conditions effectively. With this comprehensive analysis, traders can better manage risk and optimize trading strategies across multiple timeframes.
Real-world Example:
Chapter 04: SCOB on LTF and SCM on HTF across same Candle
with MTF Internal Ranges Analysis - IRA - Phoenix , explores the concepts of SCOB (Single Candle Order Block) on Lower Timeframes (LTF) and SCM (Single Candle Mitigation) on Higher Timeframes (HTF).
SCOB on LTF refers to the identification and analysis of single candle order blocks within shorter timeframes. These blocks represent critical price levels where significant buying or selling activity occurred within a single candlestick. By recognizing SCOB patterns, traders can pinpoint key areas of market interest and anticipate potential price movements.
On the other hand, SCM on HTF involves analyzing single candle mitigation entries within longer timeframes. This technique aims to capitalize on price reversals or shifts in market sentiment indicated by single candlestick patterns. By incorporating SCM analysis, traders can gain insights into broader market trends and make strategic trading decisions accordingly.
the intricacies of SCOB on LTF and SCM on HTF, offering traders valuable tools to enhance their analysis and decision-making processes across different timeframes. Through a comprehensive understanding of these concepts, traders can identify high-probability trading opportunities and navigate the markets with confidence.
Real-world Example:
SCOB on M5 and SCM on M15 generate a powerful order block.
Conclusion:
MTF Internal Ranges Analysis - IRA - Phoenix for Smart Money Concepts is a valuable asset for traders seeking to add more insights in today's dynamic markets especially for Intraday Traders. By focusing on concepts like "Multiple timeframes and Confluences, with one single timeframe u can analyze all timeframes", "SCOB Internal Order Block. With its innovative features and user-friendly interface, whether you're a seasoned trader or just starting your journey, MTF IRA - Phoenix can help you navigate through the complexities of price action and make more informed trading choices.
This document provides an extensive overview of MTF Internal Ranges Analysis - IRA - Phoenix, emphasizing its importance in comprehending market dynamics and utilizing essential smart money concepts trading principles.

Price Action Toolkit | Flux Charts💎 GENERAL OVERVIEW
Introducing our new Price Action Toolkit indicator! Price Action Toolkit integrates key level strategy , traditional supply-demand analysis , and market structures to help traders in their decisions. Now with features that are available to use in multiple timeframes!
Features of the new Price Action Toolkit indicator :
Volumized Fair Value Gaps (FVGs)
Volumized Order & Breaker Blocks
Identification of Market Structures
Equal Highs & Lows
Buyside & Sellside Liquidity
Premium & Discount Zones
MTF Highs & Lows (Daily, Weekly, Monthly, Pre-Market)
Customizable Settings
📌 HOW DOES IT WORK ?
We believe that the analytical elements that are within this indicator work best when they co-exist with each other on the chart. Trading often requires taking multiple elements into consideration for better accuracy on market analysis. Thus, we combined some of the useful strategies in one indicator for ease of use.
1. Volumized Fair Value Gaps
Fair value gaps often occur when there is an imbalance in the market, and can be spotted with a specific formation on the chart.
The volume when the FVG occurs plays an important role when determining the strength of it, so we've placed two bars on the FVG zone, indicating the high & low volumes of the FVG. The high volume is the total volume of the last two bars on a bullish FVG, while the low volume is - of the FVG. For a bearish FVG, the total volume of the last two bars is the low volume. The indicator can also detect FVGs that exist in other timeframes than the current chart.
2. Volumized Order Blocks
Order blocks occur when there is a high amount of market orders exist on a price range. It is possible to find order blocks using specific formations on the chart.
The high & low volume of order blocks should be taken into consideration while determining their strengths. The determination of the high & low volume of order blocks are similar to FVGs, in a bullish order block, the high volume is the last 2 bars' total volume, while the low volume is the oldest bar's volume. In a bearish order block scenerio, the low volume becomes the last 2 bars' total volume.
3. Volumized Breaker Blocks
Breaker blocks form when an order block fails, or "breaks". It is often associated with market going in the opposite direction of the broken order block, and they can be spotted by following order blocks and finding the point they get broken, ie. price goes below a bullish order block.
The volume of a breaker block is simply the total volume of the bar that the original order block is broken. Often the higher the breaking bar's volume, the stronger the breaker block is.
4. Market Structures
Sometimes specific market structures form and break as the market fills buy & sell orders. Formed Change of Character (CHoCH) and Break of Structure (BOS) often mean that market will change direction, and they can be spotted by inspecting low & high pivot points of the chart.
5. Equal Highs & Lows
Equal Highs & Lows occur when there is a significant amount of difference between a candle's close price and it's high / low value, and it happens again in a specific range. EQH and EQL usually mean there is a resistance that blocks the price from going further up / down.
6. Buyside & Sellside Liquidity
Buyside & Sellside Liquidity zones are where most traders place their take-profits and stop-losses in their long / short positions. They are spotted by using high & low pivot points on the chart.
7. Premium & Discount Zones
The premium zone is a zone that is over the fair value of the asset's price, and the discount zone is the opposite. They are formed by the latest high & low pivot points.
8. MTF Highs / Lows
MTF Highs / Lows are actually pretty self-explanatory, you can enable / disable Daily, Weekly, Monthly & Pre-Market Highs and Lows.
🚩UNIQUENESS
Our new indicator offers a comprehensive toolkit for traders, combining multiple analytical elements with customizable settings to aid in decision-making across different market conditions and timeframes. The volumetric information of both FVGs and Order & Breaker Blocks will be present in your chart to serve you greater detail about them. The indicator also efficiently identifies market structures, liquidity zones and premium & discount zones to give you an insight about the current state of the market. And finally with the use of multiple timeframes , you can easily take a look at the bigger picture. We recommend reading the "How Does It Work" section of the descripton to get a better understanding about how this indicator is unique to others.
⚙️SETTINGS
1. General Configuration
Show Historic Zones -> This will show historic Fair Value Gaps, Order & Breaker Blocks and Sellside & Buyside liquidities which are expired.
2. Fair Value Gaps
Enabled -> Enables / Disables Fair Value Gaps
Volumetric Info -> The volumetric information of the FVG Zones will be rendered if activated.
Zone Invalidation -> Select between Wick & Close price for FVG Zone Invalidation.
Zone Filtering -> With "Average Range" selected, algorithm will find FVG zones in comparison with average range of last bars in the chart. With the "Volume Threshold" option, you may select a Volume Threshold % to spot FVGs with a larger total volume than average.
FVG Detection -> With the "Same Type" option, all 3 bars that formed the FVG should be the same type. (Bullish / Bearish). If the "All" option is selected, bar types may vary between Bullish / Bearish.
Detection Sensitivity -> You may select between Low, Normal or High FVG detection sensitivity. This will essentially determine the size of the spotted FVGs, with lower sensitivies resulting in spotting bigger FVGs, and higher sensitivies resulting in spotting all sizes of FVGs.
3. Order Blocks
Enabled -> Enables / Disables Order Blocks
Volumetric Info -> The volumetric information of the Order Blocks will be rendered if activated.
Zone Invalidation -> Select between Wick & Close price for Order Block Invalidation.
Swing Length -> Swing length is used when finding order block formations. Smaller values will result in finding smaller order blocks.
4. Breaker Blocks
Enabled -> Enables / Disables Breaker Blocks
Volumetric Info -> The volumetric information of the Breaker Blocks will be rendered if activated.
Zone Invalidation -> Select between Wick & Close price for Breaker Block Invalidation.
5. Timeframes
You can set and enable / disable up to 3 timeframes. Note that only higher timeframes than the current chart will work.
6. Market Structures
Break Of Structure ( BOS ) -> If the current structure of the market is broken in a bullish or bearish direction, it will be displayed.
Change Of Character ( CHoCH ) -> If the market shifts into another direction, it will be displayed.
Change Of Character+ ( CHoCH+ ) -> This will display stronger Change Of Characters if enabled.
7. Equal Highs & Lows
EQH -> Enables / Disables Equal Highs.
EQL -> Enables / Disables Equal Lows.
ATR Multiplier (0.1 - 1.0) -> Determines the maximum difference between highs / lows to be considered as equal. Lower values will result in more accurate results.
8. Buyside & Sellside Liquidity
Zone Width -> Determines the width of the liquidity zones, 1 = 0.025%, 2 = 0.05%, 3 = 0.1%.
9. Premium & Discount Zones
Enabled -> Enables / Disables Premium & Discount Zones.
10. MTF Highs / Lows
You can enable / disable Daily, Weekly, Monthly & Pre-Market Highs and Lows using this setting. You can also switch their line shapes between solid, dashed and dotted.

Market Dynamics Pro [ChartPrime]ChartPrime Market Dynamics Pro is designed to cater to those traders who are more interested in market structures, price action and fundermentals. Analysing volume, key levels in the market, market phases and multi-timeframe can help a trader build a clearer and more actionable view of the market. ChartPrime performs analysis on data in a unique way therefore attempting to give insights into the market otherwise unseen.
Major Features:
Order blocks: The ChartPrime order blocks provide sleek and clear levels in the market where the price might find support and resistance. It is important to note this data isn't availible currently therefore these are derived from data outside of order books. Order blocks are segmented into 4 sections reflecting the volume at a given levels. Low, Medium, High and very high based on relevant and dynamic averages. This allows a trader to identify how significant a level is in the market in a simpler method. Bearish order blocks have a red color bias and bullish order blocks have a green color bias allowing a trader to identify what type of order block it is. The order blocks also dynamically show the remaining volume at that given level.
Pattern Detection: ChartPrime leverages unique pattern identification methods providing earlier and cleaner chart formations. Patterns are commonly used in trading to assess whether bulls or bears are performing optimally in a market or losing strength. ChartPrime identifies; Ascending wedges, descending wedges, symmetrical Triangles, H&S, iH&S, broadening wedges and double tops/bottoms. Patterns often have associated theory behind them for entries and targets that we suggest a trader covers before using this feature. ChartPrime also allow for the user to adjust where a pattern is drawn from. In pattern theory there are 2 main approaches to drawing a formation; from candle body and candle wick. ChartPrime allows for this to be adjusted by a user and also allow for alerts to be set on these patterns.
MTF SR: Taking into account multi timeframes when trading is a key idea. Having ideas of the larger market moves can provide deeper context when trading. ChartPrime Market Dynamics Pro allows for 3 varying SR plots from 3 varying user desired timeframes. These are graded via pivot analysis and grid analysis. This rank is on a 1-10 scale with 1 being the highest rank and 10 is the lowest.
Market Stucutures : These labels are commonly found and used by the Smart Money community. They denote a break of stucture and a chance of character. BOS are labelled when the price breaks a lower low or higher high (in the trending markets) and a CoC occurs when price breaks a trending market pivot. These break a market into clearer breakouts of price action and can help a trader deduce relevant moves. The indicator allows for the user to adjust the detection length of these structures.
Premium and Discount Zones: Premium and Discount zones are underpinned by a simple piece of logic. A premium zone is taken from a higher swing point and the discount from a lower swing point. Although a very generic approach this can show areas in the market that could see a reaction. An asset being in a discount zone implies the price is undervalued. An asset being in a premium zone implies the asset is overpriced or overextended. These are excellent when used in confluence with other SR methods. These naturally will have a delay as they are derived from swing points in a market but still are extremely relevant levels.
Fair Value Gaps: These are gaps in the market where price has seen a highly volatile move and they are assumed to act as magnets in the market. The price may come back and visit these 'gaps' after the move has occured. These are a common technique now used by traders and added to this toolkit for convinience.
Settings:
Order Blocks: Select the scale of the order blocks displayed
BoS/CoC: Toggle these on/off and adjust the lookback on these market structures
Premium/Discount Zones: Toggle on/off and adjust lookback
Enable FVG: Toggle on/off FVGs
Swing Levels: Enable basic swing levels in market
MTF Support/Resistance: Enable and select the relevant timeframe to obtain MTF SR levels on your chart. Up to 3 timeframes at a time.
Predictive Ranges: Toggle on/off
Trend Lines Detection: Toggle on/off trendlines
Wedge Detection: Adjust how patterns are detected; whether from wick or candle body
Toggles provided for relevant patterns.
Example usecases:
ChartPrime order blocks give a deeper insight into market support and resistance levels. Looking for order blocks labelled with High can indicate this level being a significant support or resistance in the market. Adding in further confluences here can assist further in deciding where the price may see a reaction. Take the screenshot below:
Adding in confluences from other timeframes can also help give a broader view. Using the multi time frame graded frame support and resistance levels we can use these to further assist us in finding significant levels in the market.
ChartPrime also provides breaker blocks. These are still significant levels in the market despite being "broken" prior. These too can be used in a classical manor and act as relevant areas in the market. These are particularly effective when used in confluence with Premium and discount zones. We can see in the example below price sees a strong reaction and bounces at these levels.
Market Dynamics Pro provides a comprehensive toolkit of unique features and mixes in the classical concepts allowing for a cleaner charting experience.
All content and indicators provided by ChartPrime are purely for informational & educational purposes only. Past performance does not guarantee future results.

OB**Precise Order Blocks (Unified Transparency)**
---
**Indicator Overview**
"Precise Order Blocks" is a powerful technical indicator designed to automatically identify and plot **Order Blocks** in the market. It detects both bullish and bearish order blocks and provides advanced features to help traders accurately analyze price action and potential trading opportunities.
The core design principle of this indicator is not just to mark areas but to include a dynamic management system. This ensures a clean and effective chart, displaying only the currently valid order blocks.
**Key Features**
* **Automatic Detection:** Automatically identifies and plots both bullish and bearish order blocks.
* **Dynamic Extension:** All valid order blocks will automatically extend to the right along with the price action, helping you track their influence.
* **Order Block Lifecycle Management:**
* **Precise Invalidation Logic:** Order blocks are automatically removed from the chart when their validity is compromised by a price breach. You can choose whether a **wick breakout** or a **body (close price) breakout** is required for invalidation.
* **Overlap Prevention:** The detection logic prevents new order blocks that overlap with or are contained within existing ones from being plotted, keeping your chart clean.
* **Candle Engulfing Reversal:** When an order block is completely engulfed by a reverse-direction candle, the indicator will automatically flip its direction, capturing rapid shifts in market sentiment.
* **Customizable Visuals:** You have full control over the color and transparency of the order blocks and their midlines to match your chart style.
**Parameter Settings**
* `Show Bullish OB`: Toggle the display of bullish order blocks.
* `Show Bearish OB`: Toggle the display of bearish order blocks.
* `Bullish OB Color`: Set the color for bullish order blocks.
* `Bearish OB Color`: Set the color for bearish order blocks.
* `Midline Color`: Set the color for the midline of the order blocks.
* `Max Lookback`: Limits the lookback range for the indicator's detection to avoid plotting overly old order blocks.
* `Wick Breakout Invalidation`: When enabled, a candle's wick passing through the order block area will be considered an invalidation. When disabled, only the close price passing through will invalidate it.
* `Revert on Engulfing`: When enabled, an order block will automatically reverse its direction if it's completely engulfed by an opposing candle.
**Suggested Use**
This indicator is highly effective when combined with other trading strategies, such as confirming breakouts, identifying support or resistance zones, or pairing with momentum indicators to gauge trend strength. The midline of the order block can serve as a potential price target for a bounce or a breakout.
To achieve the best visual and analytical results, we recommend adjusting the **Max Lookback** and **Invalidation** settings based on your specific trading style and time frame.
精準訂單塊(統一透明度)
---
指標簡介
「精準訂單塊」是一個型態技術指標,專為識別和繪製市場中的**訂單塊 (Order Blocks)** 而設計。它能自動偵測多頭和空頭的訂單塊,並提供進階功能,幫助交易者更精準地分析價格行為和潛在的交易機會。
本指標的設計理念不僅是簡單地標記區域,更加入了動態管理機制,以確保圖表乾淨且有效,只顯示當前有效的訂單塊。
指標功能特色
* **自動偵測訂單塊**:能自動識別並繪製看漲(多頭)和看跌(空頭)的訂單塊。
* **動態延伸**:所有有效的訂單塊都會隨價格走勢向右延伸,幫助你追蹤其影響力。
* **訂單塊生命週期管理**:
* **精準失效邏輯**:訂單塊會在其有效性被價格突破時自動消失。你可以選擇是**影線突破**還是**實體(收盤價)突破**才算失效。
* **避免重複**:偵測邏輯會排除與現有訂單塊重疊或包含在其中的新訂單塊,避免圖表混亂。
* **K 棒吞噬反轉**:當訂單塊被一根反向的 K 棒完全吞噬時,本指標會將其自動反轉為新的訂單塊,捕捉市場情緒的快速轉變。
* **可自訂視覺效果**:你可以自由調整訂單塊與中線的顏色、透明度,以適應你的圖表風格。
參數設定
* `顯示看漲訂單塊`:開啟或關閉看漲訂單塊的顯示。
* `顯示看跌訂單塊`:開啟或關閉看跌訂單塊的顯示。
* `看漲訂單塊顏色`:設定看漲訂單塊的顏色。
* `看跌訂單塊顏色`:設定看跌訂單塊的顏色。
* `中線顏色`:設定訂單塊中線的顏色。
* `最大回溯 K 棒數`:限制指標回溯偵測的範圍,避免顯示過於老舊的訂單塊。
* `影線突破就算失效`:當此選項開啟,K 棒的影線穿過訂單塊區域即視為失效;關閉則只有收盤價穿過才算失效。
* `K 棒吞噬時反向`:開啟此選項後,當訂單塊被反向 K 棒完全吞噬時,會自動反轉其方向。
使用建議
本指標非常適合與其他交易策略結合使用,例如確認突破、尋找支撐或阻力區域、或是與動量指標搭配來判斷趨勢強度。它提供的訂單塊中線可以用作潛在的價格反彈或突破目標。
在使用時,建議根據你的交易風格和時間週期,調整**最大回溯 K 棒數**和**失效條件**,以達到最佳的視覺與分析效果。

Nexus One v1.1Introduction
My Order Block Indicator is THE cutting-edge trading tool designed to offer traders an unparalleled edge in the markets. This unique indicator combines order blocks, fair value gaps, exponential moving averages (EMAs), and vector candles into a cohesive Nexus strategy. Unlike traditional indicators, this tool leverages the synergistic effects of these components to identify high-probability trading setups.
How It Works
Order Blocks: At the heart of our indicator are pivot-based order blocks. These are price levels or ranges that are significant due to past market activity. Our algorithm identifies these blocks based on historical pivot points, considering both the price's reaction to these levels and their recurrence over time. This method helps in pinpointing areas where institutional orders are likely to be placed.
Fair Value Gaps: Alongside, our indicator detects fair value gaps - regions where price has moved too swiftly, leaving a gap in the market's valuation. By identifying these gaps, the tool helps traders anticipate areas where price might return to fill the gap, offering strategic entry and exit points.
EMAs and Vector Candles: To refine our signals, the indicator utilizes a combination of exponential moving averages and vector candles. EMAs help in determining the market's trend direction, while vector candles offer insights into the momentum and strength of price movements. The integration of these elements enables our tool to filter out lower probability setups, focusing on those with higher chances of success.
Originality and Usefulness
My Order Block Indicator is not merely a combination of existing tools. It represents a novel approach to market analysis, integrating various components into a single, comprehensive trading strategy. The methodology behind combining real time order blocks with fair value gaps and EMAs, supplemented by the unique use of vector candles, is proprietary and designed to offer original insights into market dynamics.
This tool is invaluable for traders looking to enhance their market analysis, providing a deeper understanding of price movements and potential reversal points. Whether for scalping, day trading, or swing trading, our indicator offers versatile applications, helping traders to navigate the complexities of various market conditions with greater confidence.
How to Use
To make the most of my Order Block Indicator:
Setup: Apply the indicator to any chart or time frame, tailoring the EMA settings according to your trading style.
Interpretation: Look for confluences between real time order blocks and fair value gaps as high-probability entry points. EMAs will guide you on the trend's direction, while vector candles highlight momentum strength.
Application: Use the indicator to identify potential reversal zones, entry, and exit points. Combine it with The Nexus risk management strategy to optimize your trading performance.
Conclusion
My Order Block Indicator is crafted for traders who demand depth, precision, and originality in their tools. It stands out by providing a multifaceted approach to market analysis, backed by a proprietary integration of critical trading concepts. This tool is not just an indicator; it's a comprehensive strategy designed to elevate your trading journey.

Smarter Money Concepts - OBs [PhenLabs]📊 Smarter Money Concepts - OBs
Version: PineScript™ v6
📌 Description
Smarter Money Concepts - OBs (Order Blocks) is an advanced technical analysis tool designed to identify and visualize institutional order zones on your charts. Order blocks represent significant areas of liquidity where smart money has entered positions before major moves. By tracking these zones, traders can anticipate potential reversals, continuations, and key reaction points in price action.
This indicator incorporates volume filtering technology to identify only the most significant order blocks, eliminating low-quality signals and focusing on areas where institutional participation is likely present. The combination of price structure analysis and volume confirmation provides traders with high-probability zones that may attract future price action for tests, rejections, or breakouts.
🚀 Points of Innovation
Volume-Filtered Block Detection : Identifies only order blocks formed with significant volume, focusing on areas with institutional participation
Advanced Break of Structure Logic : Uses sophisticated price action analysis to detect legitimate market structure breaks preceding order blocks
Dynamic Block Management : Intelligently tracks, extends, and removes order blocks based on price interaction and time-based expiration
Structure Recognition System : Employs technical analysis algorithms to find significant swing points for accurate order block identification
Dual Directional Tracking : Simultaneously monitors both bullish and bearish order blocks for comprehensive market structure analysis
🔧 Core Components
Order Block Detection : Identifies institutional entry zones by analyzing price action before significant breaks of structure, capturing where smart money has likely positioned before moves.
Volume Filtering Algorithm : Calculates relative volume compared to a moving average to qualify only order blocks formed with significant market participation, eliminating noise.
Structure Break Recognition : Uses price action analysis to detect legitimate breaks of market structure, ensuring order blocks are identified only at significant market turning points.
Dynamic Block Management : Continuously monitors price interaction with existing blocks, extending, maintaining, or removing them based on current market behavior.
🔥 Key Features
Volume-Based Filtering : Filter out insignificant blocks by requiring a minimum volume threshold, focusing only on zones with likely institutional activity
Visual Block Highlighting : Color-coded boxes clearly mark bullish and bearish order blocks with customizable appearance
Flexible Mitigation Options : Choose between “Wick” or “Close” methods for determining when a block has been tested or mitigated
Scan Range Adjustment : Customize how far back the indicator looks for structure points to adapt to different market conditions and timeframes
Break Source Selection : Configure which price component (close, open, high, low) is used to determine structure breaks for precise block identification
🎨 Visualization
Bullish Order Blocks : Blue-colored rectangles highlighting zones where bullish institutional orders were likely placed before upward moves, representing potential support areas.
Bearish Order Blocks : Red-colored rectangles highlighting zones where bearish institutional orders were likely placed before downward moves, representing potential resistance areas.
Block Extension : Order blocks extend to the right of the chart, providing clear visualization of these significant zones as price continues to develop.
📖 Usage Guidelines
Order Block Settings
Scan Range : Default: 25. Defines how many bars the indicator scans to determine significant structure points for order block identification.
Bull Break Price Source : Default: Close. Determines which price component is used to detect bullish breaks of structure.
Bear Break Price Source : Default: Close. Determines which price component is used to detect bearish breaks of structure.
Visual Settings
Bullish Blocks Color : Default: Blue with 85% transparency. Controls the appearance of bullish order blocks.
Bearish Blocks Color : Default: Red with 85% transparency. Controls the appearance of bearish order blocks.
General Options
Block Mitigation Method : Default: Wick, Options: Wick, Close. Determines how block mitigation is calculated - “Wick” uses high/low values while “Close” uses close values for more conservative mitigation criteria.
Remove Filled Blocks : Default: Disabled. When enabled, order blocks are removed once they’ve been mitigated by price action.
Volume Filter
Volume Filter Enabled : Default: Enabled. When activated, only shows order blocks formed with significant volume relative to recent average.
Volume SMA Period : Default: 15, Range: 1-50. Number of periods used to calculate the average volume baseline.
Min. Volume Ratio : Default: 1.5, Range: 0.5-10.0. Minimum volume ratio compared to average required to display an order block; higher values filter out more blocks.
✅ Best Use Cases
Identifying high-probability support and resistance zones for trade entries and exits
Finding optimal stop-loss placement behind significant order blocks
Detecting potential reversal areas where price may react after extended moves
Confirming breakout trades when price clears major order blocks
Building a comprehensive market structure map for medium to long-term trading decisions
Pinpointing areas where smart money may have positioned before major market moves
⚠️ Limitations
Most effective on higher timeframes (1H and above) where institutional activity is more clearly defined
Can generate multiple signals in choppy market conditions, requiring additional filtering
Volume filtering relies on accurate volume data, which may be less reliable for some securities
Recent market structure changes may invalidate older order blocks not yet automatically removed
Block identification is based on historical price action and may not predict future behavior with certainty
💡 What Makes This Unique
Volume Intelligence : Unlike basic order block indicators, this script incorporates volume analysis to identify only the most significant institutional zones, focusing on quality over quantity.
Structural Precision : Uses sophisticated break of structure algorithms to identify true market turning points, going beyond simple price pattern recognition.
Dynamic Block Management : Implements automatic block tracking, extension, and cleanup to maintain a clean and relevant chart display without manual intervention.
Institutional Focus : Designed specifically to highlight areas where smart money has likely positioned, helping retail traders align with institutional perspectives rather than retail noise.
🔬 How It Works
1. Structure Identification Process :
The indicator continuously scans price action to identify significant swing points and structure levels within the specified range, establishing a foundation for order block recognition.
2. Break Detection :
When price breaks an established structure level (crossing below a significant low for bearish breaks or above a significant high for bullish breaks), the indicator marks this as a potential zone for order block formation.
3. Volume Qualification :
For each potential order block, the algorithm calculates the relative volume compared to the configured period average. Only blocks formed with volume exceeding the minimum ratio threshold are displayed.
4. Block Creation and Management :
Valid order blocks are created, tracked, and managed as price continues to develop. Blocks extend to the right of the chart until they are either mitigated by price action or expire after the designated timeframe.
5. Continuous Monitoring :
The indicator constantly evaluates price interaction with existing blocks, determining when blocks have been tested, mitigated, or invalidated, and updates the visual representation accordingly.
💡 Note:
Order Blocks represent areas where institutional traders have likely established positions and may defend these zones during future price visits. For optimal results, use this indicator in conjunction with other confluent factors such as key support/resistance levels, trendlines, or additional confirmation indicators. The most reliable signals typically occur on higher timeframes where institutional activity is most prominent. Start with the default settings and adjust parameters gradually to match your specific trading instrument and style.

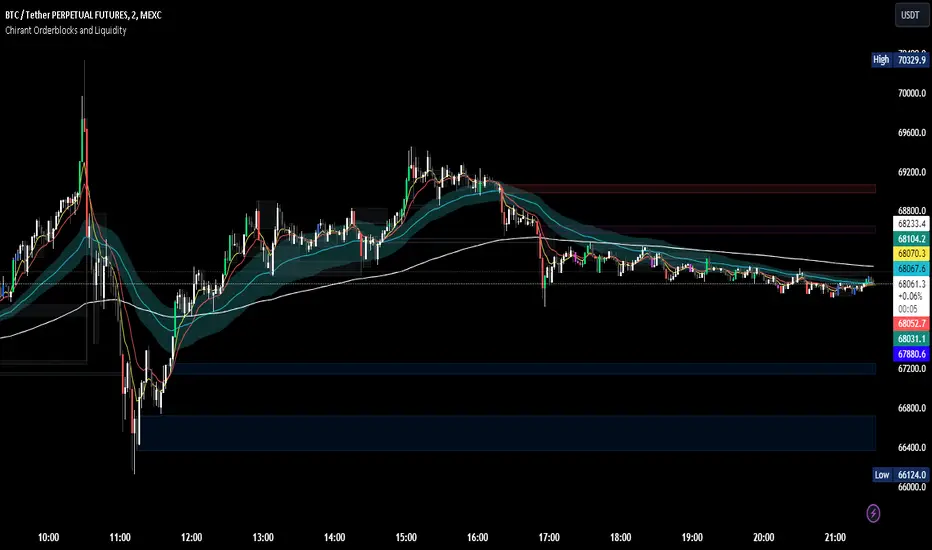
Chirant Orderblocks and LiquidityIntroduction
Our Pivot-Based Order Block Indicator is a cutting-edge trading tool designed to offer traders an unparalleled edge in the markets. This unique indicator combines pivot-based order blocks, fair value gaps, exponential moving averages (EMAs), and vector candles into a cohesive strategy. Unlike traditional indicators, this tool leverages the synergistic effects of these components to identify high-probability trading setups.
How It Works
Pivot-Based Order Blocks: At the heart of our indicator are pivot-based order blocks. These are price levels or ranges that are significant due to past market activity. Our algorithm identifies these blocks based on historical pivot points, considering both the price's reaction to these levels and their recurrence over time. This method helps in pinpointing areas where institutional orders are likely to be placed.
Fair Value Gaps: Alongside, our indicator detects fair value gaps - regions where price has moved too swiftly, leaving a gap in the market's valuation. By identifying these gaps, the tool helps traders anticipate areas where price might return to fill the gap, offering strategic entry and exit points.
EMAs and Vector Candles: To refine our signals, the indicator utilizes a combination of exponential moving averages and vector candles. EMAs help in determining the market's trend direction, while vector candles offer insights into the momentum and strength of price movements. The integration of these elements enables our tool to filter out lower probability setups, focusing on those with higher chances of success.
Originality and Usefulness
Our Pivot-Based Order Block Indicator is not merely a combination of existing tools. It represents a novel approach to market analysis, integrating various components into a single, comprehensive trading strategy. The methodology behind combining pivot-based order blocks with fair value gaps and EMAs, supplemented by the unique use of vector candles, is proprietary and designed to offer original insights into market dynamics.
This tool is invaluable for traders looking to enhance their market analysis, providing a deeper understanding of price movements and potential reversal points. Whether for scalping, day trading, or swing trading, our indicator offers versatile applications, helping traders to navigate the complexities of various market conditions with greater confidence.
How to Use
To make the most of our Pivot-Based Order Block Indicator:
Setup: Apply the indicator to any chart or time frame, tailoring the EMA settings according to your trading style.
Interpretation: Look for confluences between pivot-based order blocks and fair value gaps as high-probability entry points. EMAs will guide you on the trend's direction, while vector candles highlight momentum strength.
Application: Use the indicator to identify potential reversal zones, entry, and exit points. Combine it with your risk management strategy to optimize your trading performance.
Conclusion
Our Pivot-Based Order Block Indicator is crafted for traders who demand depth, precision, and originality in their tools. It stands out by providing a multifaceted approach to market analysis, backed by a proprietary integration of critical trading concepts. This tool is not just an indicator; it's a comprehensive strategy designed to elevate your trading journey.
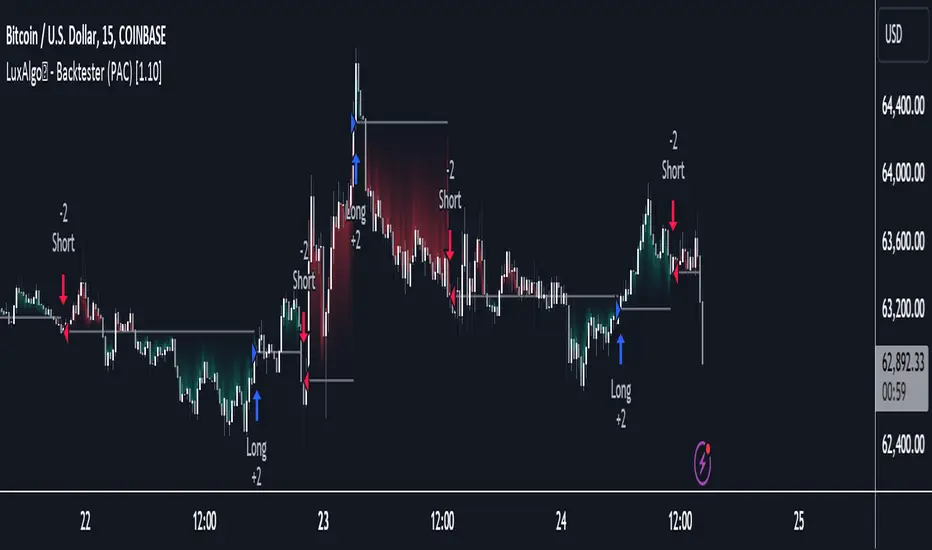
LuxAlgo - Backtester (PAC)The PAC Backtester is an innovative strategy script that allows users to create a wide variety of strategies derived from price action-related concepts for a data-driven approach to discretionary trading strategies.
Thanks to our 'Step' and 'Match' algorithm, users can create custom and complex strategy entries and exits from features such as market structure, order blocks, imbalances, as well as any external indicators, allowing users to create entries from a sequence of conditions and/or multiple matching conditions.
We included a complete alert system that will send a notification for each action taken by the strategy and we also allow users to set custom messages for each action taken by a strategy.
🔶 Features
🔹 Step & Match Algorithm
More complex entry rules can be created by using multiple conditions together, this is done thanks to the Step dropdown setting on the right of each condition.
The Step setting is directly related to the Step & Match algorithm and works in two ways:
When two or more conditions have the same step number, both conditions are evaluated. Used to test matching conditions.
When two or more conditions have different step numbers, each condition will be evaluated in order, testing for the first step and switching to the next step once the previous one is true. When the final step is true the strategy will open a market order. Used to create a sequence of conditions.
This operation is complementary, as you can create a sequence of conditions with one step consisting of two or more matching conditions as long as they have the same step number.
🔹 Fully Customizable Price Action Concepts As Entries
We allow the users to use market structures, order blocks, imbalances, and external sources together to set their custom entry and exit conditions.
Market structures are commonly used to determine trend direction by indicating when prices break prior swing points. Their occurrence can be used as entry conditions.
Order blocks highlight areas where institutional market participants open positions, one can use order blocks to determine confirmation entries or potential targets as we can expect there is a large amount of liquidity at these order blocks. Price entering, being within, or mitigating an order block can be used as an entry condition.
Market imbalances highlight areas where there is a disparity between supply and demand. Price entering, being within, or mitigating an imbalance can be used as an entry condition.
This system also allows the use of external sources to create entry and exit conditions, such as moving averages, bands, trailing stops...etc.
🔹 Complete Alert System
Users can get alerted for any action executed by a strategy, from opening positions to closing them.
The message field in the Alert Messages setting section allows for the strategy to send a custom alert message depending on the action taken by the strategy, if no messages are set the strategy will send default messages.
🔶 Usage
Users can create complete price action strategies from this script, let's see an example using the following entry conditions:
Long: Mitigated bearish order block occurring during the New York session after a mitigated bearish imbalance.
Short: Mitigated bullish order block occurring during the New York session after a mitigated bullish imbalance.
Take Profit: 2 points away from the entry price.
Stop Loss: 1 point away from the entry price.
We can also use features from Price Action Concepts™ to construct custom exit conditions, leading to the following strategy conditions:
Long: Bullish CHoCH and price mitigates bearish FVG.
Short: Bearish CHoCH and price mitigates bullish FVG.
Exit Long: Price mitigates bearish order block.
Exit Short: Price mitigates bullish order block.
Users can achieve a wide variety of results by using external indicators as an input source for entries and exits, combining the best from price action and technical indicators. We might for example be interested in exiting a position when the RSI oscillator is overbought or oversold.
🔶 Strategy Properties (Important)
This script backtest is done on daily EURGBP, using the following backtesting properties:
Balance (default): 10 000 (default base currency)
Order Size: 10% of the equity
Comission: 3.4 pips (average spread for EURGBP)
Slippage: 1 tick
Stop Loss: 0.01 points away from entry price
We use these properties to ensure a realistic preview of the backtesting system, do note that default properties can be different for various reasons described below:
Order Size: 1 contract by default, this is to allow the strategy to run properly on most instruments such as futures.
Comission: Comission can vary depending on the market and instrument, there is no default value that might return realistic results.
We strongly recommend all users to ensure they adjust the Properties within the script settings to be in line with their accounts & trading platforms of choice to ensure results from strategies built are realistic.
🔶 How to access
You can see the Author's Instructions below to learn how to get access.
Lune Technical Analysis Premium⬛️ Overview
Lune Technical Analysis is a state-of-the-art TradingView indicator, meticulously designed to provide real-time market insights. Distinguished by its non-repainting features that operate in real-time, this tool brings enhanced accuracy and timeliness to your market analysis.
🟦 Features
Lune Technical Analysis equips traders with an array of innovative features:
🔹 Candle Coloring: The Candle Coloring feature introduces an innovative approach to visualizing market sentiment by coloring chart candles. It is devised to streamline your market analysis, offering a readily digestible snapshot of market trends. For example, if you aim to gauge the predominant market sentiment promptly, enable this feature for instant candle color-coding in accordance with prevailing bullish or bearish market structures. Though it currently supports only Market Structure-based Candle Coloring, its settings can be manipulated for enabling or disabling this feature. This feature operates by applying predefined algorithms that interpret market sentiment, coloring the candles accordingly.
🔹 Chart Pattern Detection: This sophisticated tool automatically detects and illustrates common chart patterns on your chart, simplifying the process of pattern identification. It identifies a range of patterns such as Head & Shoulders, Inverted Head & Shoulders, Ascending/Descending Wedges, Broadening Wedges, various Triangles, and Double Tops/Bottoms, enhancing your confluence detection in the market. For example, upon detecting a Double Top pattern, you could anticipate a potential price reversal due to this bearish signal. The sensitivity of this tool can be customized according to your trading style, with lower settings for short-term changes and higher for long-term. This feature leverages predefined formulas and price action analysis to identify these patterns.
🔹 Trendlines: With the Automatic Trendline Drawing tool, your technical analysis becomes significantly more efficient and precise. This feature is engineered to identify upward and downward Trendlines, aiding in locating potential pivots, and market support/resistance. For instance, if the price consistently rebounds off a Trendline, it may continue to do so, serving as a support/resistance level. However, a break through the Trendline could signal potential volatility and trend change. This feature's sensitivity to price changes can be adjusted to either short or long-term. It works by tracing Trendlines based on price action and wick formations to detect potential pivots.
🔹 Liquidity Bubbles: Liquidity Bubbles is an advanced tool that pinpoints key liquidity areas and large positions in real-time. This feature significantly contributes to effective trading strategy formulation by highlighting potential entry and exit points. It operates in real-time, ensuring zero repaint or lag, and supports two modes: Enhanced Bubbles and Basic Bubbles. For instance, the detection of multiple bullish Liquidity Bubbles during a ranging market could suggest an upward price movement due to dominant bullish volume. This feature's settings include thresholds for insignificant bubble filtering and a mode selection feature. Liquidity Bubbles operates by applying a proprietary formula to volume data, determining general volume direction and potential positions.
🔹 Market Structure: The Market Structure tool identifies key market structures such as Break of Structures (BoS) and Change of Character (ChoCh), thereby enhancing your ability to read market trends and sentiment. This smart money concept gives you a unique insight into short-term and long-term market trends. For instance, the appearance of a bullish Break of Structure and Change of Character after a predominantly bearish market sentiment could suggest a new bullish trend. This feature allows users to select which Market Structures to display and calculates these structures based on the market's high and low points.
🔹 Order Blocks: Order Blocks provide a visual representation of areas where large market participants are likely to place orders. These zones, where significant buying or selling activity has occurred in the past, offer insightful data for future price movements. The Order Blocks feature operates in real-time, providing real-time Order Blocks without any lag. For instance, if the price enters a large Order Block with predominantly bullish volume, an upward price movement can be anticipated. However, if the price breaks through the block, it could suggest the block's invalidation and a likely continued price fall. You can configure the settings to enable an additional Order Block, customize timeframes, overlap functions, and apply a quality filter. This feature calculates Order Blocks using the volume and candle size data.
🔹 Supply/Demand Zones: This real-time tool identifies crucial supply and demand zones, revealing potential price reaction points. These zones, where supply (selling pressure) and demand (buying pressure) have historically impacted price significantly, provide traders with insights into potential areas of strong support (demand) and resistance (supply). For example, if the price enters a large supply zone, a price rejection could be anticipated due to historical selling pressure at this zone. The settings enable users to add an additional Supply/Demand Zone, customize the timeframe, and apply a quality filter. This feature identifies common Supply/Demand Zones patterns based on volume and the size of the zone and displays them on the chart.
🔹 Fair Value Gaps: The Fair Value Gaps tool is designed to identify potential price correction zones or "gaps". These areas, where the market price sharply deviated from the fair value, suggest potential price adjustments in the future. For instance, the formation of a bullish Fair Value Gap could indicate a future price drop to fill this gap, potentially followed by an upward movement if the gap was of fair value. The settings allow users to enable additional Fair Value Gaps, customize the timeframe, and apply a quality filter. This feature measures large market gaps based on the size of the gap and its volume.
These features and tools collectively offer a comprehensive solution for traders to understand and navigate the financial markets. It's important to remember that they are designed to assist in making informed trading decisions and should be used as part of a balanced trading strategy.
🟧 Usage
Lune Technical Analysis's unique feature set can be leveraged both individually and synergistically. It is important to understand each feature and experiment with different configurations to best suit your unique trading needs.
🔸 Example #1: The following example demonstrates how the Order Block and Liquidity Bubbles feature can be used together to enhance your market analysis.
Order Blocks work in real-time to identify key order zones based on price action. These zones are often crucial for predicting price fluctuations. Meanwhile, Liquidity Bubbles act as real-time visual cues that detect significant market positions, facilitating an understanding of market accumulation, distribution, and trapped positions.
In this instance, at point 1, a bearish Basic and Enhanced Liquidity Bubble is visible within a crucial Order Block. The combination of these indicators augments the bearish sentiment, leading to a potential price decrease. Similarly, at point 2, the conjunction of two bullish Basic Liquidity Bubbles within an Order Block strengthens the bullish sentiment, culminating in a subsequent price increase.
🔸 Example #2: The following example demonstrates how Supply and Demand Zones can be used to detect strong and quality supports and resistance.
Supply and Demand Zones operate in real-time, detecting crucial zones based on price action and volume. This feature is invaluable for predicting potential price reaction points.
At point 1, the price enters a Supply Zone, a historical hotspot for selling activity, which usually leads to a price rejection and consequent decrease. At point 2, a Demand Zone indicating a bullish sentiment suggests a potential reversal when the price touches this level.
🔸 Example #3: The following example demonstrates how the Chart Pattern Detection feature is able to detect chart patterns to help enhance your trades.
Chart Pattern Detection employs formulas and price action analysis to identify common chart patterns as they form. Here, it successfully detects a 'Head and Shoulders' pattern, a conventionally bearish pattern, indicating a potential price drop.
🟥 Conclusion
Lune Technical Analysis stands as an exceptional blend of real-time insights into market activity. Its real-time, non-repainting features offer traders a more precise and timely approach to market analysis, promoting improved decision making in ever-changing market conditions.
🔻 Access
You can see the Author's instructions below to get instant access to this indicator & our Premium Suite.
🔻 Disclaimer
Lune Technical Analysis is a tool for aiding in market analysis and is not a guarantee of future market performance or individual trading success. We strongly recommend that users combine our tool with their trading strategies and do their due diligence before making any trading decisions.
Remember, past performance is not indicative of future results. Please trade responsibly.

MMM @MaxMaserati 2.0MMM @MaxMaserati 2.0 - TradingView Indicator
The Backbone of the Max Maserati Method
The MMM @MaxMaserati 2.0 indicator is the core of the proprietary Max Maserati Method (MMM), a trading system designed to decode institutional price action. It integrates candle bias analysis, market structure identification, volume-based signals, and precise entry zones to align traders with smart money.
Core Components of the MMM System
1. Six Core Candle Classifications
Master these patterns to reveal institutional behavior:
Bullish Body Close: Closes above previous high, signaling strong buying.
Bearish Body Close: Closes below previous low, indicating intense selling.
Bullish Affinity: High tests previous low, closes within range, showing hidden bullish strength.
Bearish Affinity: Low tests previous high, closes within range, reflecting bearish pressure.
Seek & Destroy: Breaks both previous high/low, closes inside, direction depends on close.
Close Inside: High/low within previous range, bias based on close.
2. Plus/Minus Strength System
Quantifies candle conviction:
Bullish Strength: Low to close distance.
Bearish Strength: High to close distance.
Plus (+): Dominant strength signals strong follow-through.
Minus (-): Balanced strengths suggest caution.
3. PO4 Candles (Power of OHLC (4))
Analyzes OHLC for body-closed candles after swing high/low fractals:
C2: Body close above high/below low post fractal with strength conditions.
C3: Stronger body close with pronounced low/high breakouts.
C4: Body close which show strength and might trigger a BeB/BuB
Visualization: Green (bullish), purple (bearish) bars; triangle markers for fractals.
4. MC2 (High Volume Reversal Candles)
High buy/sell volume candles reversed by opposing volume:
Bullish MC2: Buy volume flipped by sell volume, signaling exhaustion.
Bearish MC2: Sell volume flipped by buy volume, indicating reversal.
Visualization: Dark green (bullish), dark red (bearish) bars.
5. MMM Blocks (eBlocks and iBlocks)
Marks institutional order blocks:
External Blocks (eBlocks): At market structure changes (MSC), labeled BuB/BeB.
Internal Blocks (iBlocks): Within trends, labeled L/S.
Volume: Normalized with indicators (🔥 high, ↑ above average, ↓ low).
Filters: Discount (0-50), premium (50-100), extreme (0-20, 80-100), mid-range (20-50, 50-80).
6. Entry Blocks - Specific Entry Areas
Entry Blocks are precise zones for framing trades based on the MMM system, triggered post-MSC to capitalize on institutional momentum:
Purpose: Pinpoint high-probability entry areas following a Market Structure Change (MSC), aligning with smart money direction.
Formation:
MMM Entry Block Long: Forms after a bullish MSC (BuB), typically at the swing low (e.g., lowerValueMSC) of the fractal pattern, marking a long entry zone.
MMM Entry Block Short: Forms after a bearish MSC (BeB), typically at the swing high (e.g., upperValueMSC), marking a short entry zone.
Styles :
Close-to-Swing High/Low: Box drawn from the candle’s close to the swing high/low level, emphasizing the fractal pivot.
High/Low-to-Close: Box drawn from the candle’s high/low to its close, capturing the full price action range.
Visualization:
Labeled “MMM Entry Block Long” (cyan background/border) or “Short” (pink background/border).
Includes a dashed midline for reference.
Volume displayed if enabled, normalized with markers (🔥 >150%, ⚡ >120%, ❄️ <70%).
Behavior:
Deletes when price touches the level (On Level Touch) or closes beyond it (On Candle Close)
Limited to a configurable number ( default 5) to avoid clutter.
Trade Framing:
Entry: Enter within the eBreak box, ideally on a pullback or confirmation candle aligning with MMM bias (e.g., Bullish Body Close or Affinity).
Stop-Loss: Placed below the eBreak low (bullish) or above the high (bearish), leveraging the swing level as support/resistance.
Take-Profit: Targets higher timeframe high (bullish) or low (bearish), with ratio (default 2.0) for risk-reward.
MMM Integration: Use candle bias (Plus/Minus), PO4 signals, and MMPD consensus to confirm entry direction and strength.
Significance: eBreaks frame trades by isolating institutional entry points post-MSC, reducing noise and enhancing precision.
7. Market Structure Change (MSC)
Tracks structure shifts:
Detection: Fractal highs/lows with adjustable candle count.
Visualization: Green (BuB), red (BeB) lines/labels; numbered breaks (Bub1/Beb1).
Counter: Tracks consecutive MSCs for trend strength.
8. MMPD (Market Momentum Price Delivery)
Analyzes momentum/trend:
Conditions: Red (bearish), Green (bullish), Pink (modifying bearish), Pale Green (modifying bullish).
Traps: Flags bullish/bearish traps when MMPD conflicts with body close.
Metrics: SuperMaxTrend, momentum (K/D), MMPD level.
Consensus: Rated signals (e.g., “Very Strong Buy ★★★★★”).
9. Trade and Risk Management
Disciplined trading:
Entry Visualization: Entry, stop-loss, take-profit lines/labels with customizable risk (riskAmount, default $50) and reward (ratio).
Behavior: Shows last/all entries, removes on MSC shift or breach.
Text Size: Tiny, Small, Normal.
NB: The Trade and risk management is to use with caution, it is not fully implemented yet.
10. Stats Table
Real-time dashboard:
Elements: Timeframe, symbol, candle bias, strength, MMPD, momentum, SuperMaxTrend, MMPD level, volume, consensus, divergence, delta MA, price delivery, note (“Analyze | Wait | Repeat”).
Customization: Position, size, element visibility.
Colors: Green (bullish), red (bearish), orange (warnings), gray (neutral).
11. Delta MA and Divergence
Monitors volume delta:
Delta MA: Smoothed delta with direction arrows (↗↘→).
Divergence: Flags MMPD-momentum divergences (⚠️).
Key Features
Automated Analysis: Detects PO4, MSC, blocks, MC2, Entry Block via OHLC.
Color-Coded Visualization: Bars, lines, table cells reflect bias/strength.
Dynamic Bias Lines: Higher timeframe high/low lines with labels.
Volume Analysis: Normalized volume across blocks, entries, MC2.
Flexible Filters: Tailors block/entry Block display to strategies.
Real-Time Metrics: Tracks strength, delta, trend points.
Trading Advantages
Institutional Insight: Decodes manipulation via OHLC and volume.
Early Reversals: Spots shifts via PO4, MC2, MSC, Entry Blocks.
Precise Entries: entry block frame high-probability trades.
Robust Risk Management: Stop-loss, take-profit, risk-reward.
Simplified Complexity: Actionable signals from complex action.
Profit Target Framework
Bullish: Higher timeframe high.
Bearish: Higher timeframe low.
Plus Strength: Direct move.
Minus Strength: Pullbacks expected.
Entry Blocks/MSC-Driven: Entry anchor entries to MSC targets.
Trader’s Mantra
“Analyze | Wait | Repeat” - Discipline drives profits.
The MMM @MaxMaserati 2.0 indicator, with Entry Blocks as specific trade-framing zones, offers a professional-grade framework for precise, institutional-aligned trading.
Note: Based on the proprietary Max Maserati Method for educational and analytical use.
ICT Comprehensive IndicatorThe ICT Comprehensive Indicator is a robust tool designed to assist traders in applying key concepts from the Inner Circle Trader (ICT) methodology directly to their TradingView charts. This indicator integrates multiple ICT principles to provide a holistic view of the market, aiming to enhance trading analysis and decision-making.
Key Features:
Market Structure Analysis:
Swing Highs and Lows:
Automatically identifies and marks significant swing highs and lows.
Plots dotted lines at these levels to help visualize market structure and trend direction.
Red Lines: Indicate swing highs (potential resistance levels).
Green Lines: Indicate swing lows (potential support levels).
Liquidity Pools:
Highlights potential liquidity zones where stop orders may accumulate.
Marks previous swing highs and lows with small circles to identify areas institutions might target for liquidity.
Order Blocks Identification:
Bullish Order Blocks:
Detects the last down candle before a significant up move.
Draws solid green lines extended to the right, representing potential support zones.
Bearish Order Blocks:
Detects the last up candle before a significant down move.
Draws solid red lines extended to the right, representing potential resistance zones.
Fair Value Gaps (Imbalance):
Identifies and highlights gaps in price action where the market moved rapidly, leaving imbalances.
Draws semi-transparent purple boxes to indicate areas where the price may retrace to fill unfilled orders.
Time and Price Theory:
Trading Sessions Highlighting:
Allows selection of major trading sessions: London, New York, or Asian.
Highlights the chosen session on the chart with a semi-transparent blue background.
Helps focus analysis during periods of higher liquidity and volatility.
Risk Management Display:
Calculates and displays the risk amount per trade based on user-defined account size and risk percentage.
Shows a label on the chart with the calculated risk amount to aid in proper position sizing.
Custom Alerts:
Provides alerts for key events:
Formation of new swing highs or lows.
Identification of bullish or bearish order blocks.
Detection of fair value gaps (both up and down).
How to Use:
Add the Indicator to Your Chart:
Search for "ICT Comprehensive Indicator" in the TradingView Indicators library.
Add it to your chart to begin analyzing the market using ICT concepts.
Configure Settings:
Trading Session Selection:
Choose your preferred trading session in the settings to highlight it on the chart.
Risk Management Inputs:
Input your account size and desired risk percentage per trade to calculate the risk amount.
Analyze the Market:
Market Structure:
Use the swing highs and lows to understand the current market trend.
Liquidity Pools and Order Blocks:
Identify potential entry and exit points by observing marked liquidity zones and order blocks.
Fair Value Gaps:
Look for possible retracement areas where the price may return to fill imbalances.
Set Up Alerts:
Configure alerts based on the indicator's conditions to stay informed of significant market events without constant monitoring.
Benefits:
Holistic Analysis Tool:
Combines multiple ICT principles into one indicator for comprehensive market analysis.
Enhanced Decision-Making:
Aids in identifying high-probability trade setups by highlighting key market areas.
Time-Efficient:
Automates the detection of complex trading concepts, saving time on manual analysis.
Customizable:
Adjustable settings allow tailoring the indicator to individual trading styles and preferences.
Disclaimer:
This indicator is intended for educational and informational purposes only.
Trading involves significant risk, and past performance is not indicative of future results.
Always conduct thorough analysis and consult with a financial advisor before making trading decisions.
Note:
This indicator is inspired by ICT concepts but is not affiliated with or endorsed by Inner Circle Trader.
Users are encouraged to have a foundational understanding of ICT methodologies to fully benefit from this tool.

OrderBlock Trend (CISD)OrderBlock Trend (CISD) Indicator
Overview:
The "OrderBlock Trend (CISD)" AKA: change in state of delivery by ICT inner circle trader this indicator is designed to help traders identify and visualize market trends based on higher timeframe candle behavior. This script leverages the concept of order blocks, which are price levels where significant buying or selling activity has occurred, to signal potential trend reversals or continuations. By analyzing bullish and bearish order blocks on a higher timeframe, the indicator provides visual cues and statistical insights into the market's current trend dynamics.
Key Features:
Higher Timeframe Analysis: The indicator uses a higher timeframe (e.g., Daily) to assess the trend direction based on the open and close prices of candles. This approach helps in identifying more significant and reliable trend changes, filtering out noise from lower timeframes.
Bullish and Bearish Order Blocks: The script detects the first bullish or bearish candle on the selected higher timeframe and uses these candles as reference points (order blocks) to determine the trend direction. A bullish trend is indicated when the current price is above the last bearish order block's open price, and a bearish trend is indicated when the price is below the last bullish order block's open price.
Visual Trend Indication: The indicator visually represents the trend using background colors and plot shapes:
A green background and a square shape above the bars indicate a bullish trend.
A red background and a square shape above the bars indicate a bearish trend.
Candle Count and Statistics: The script keeps track of the number of up and down candles during bullish and bearish trends, providing percentages of up and down candles in each trend. This data is displayed in a table, giving traders a quick overview of market sentiment during each trend phase.
User Customization: The higher timeframe can be adjusted according to the trader's preference, allowing flexibility in trend analysis based on different time horizons.
Concepts and Calculations:
The "OrderBlock Trend (CISD)" indicator is based on the concept of order blocks, a key area where institutional traders are believed to place large orders, creating significant support or resistance levels. By identifying these blocks on a higher timeframe, the indicator aims to highlight potential trend reversals or continuations. The use of higher timeframe data helps filter out minor fluctuations and focus on more meaningful price movements.
The candle count and percentage calculations provide additional context, allowing traders to understand the proportion of bullish or bearish candles within each trend. This information can be useful for assessing the strength and consistency of a trend.
How to Use:
Select the Higher Timeframe: Choose the higher timeframe (e.g., Daily) that best suits your trading strategy. The default setting is "D" (Daily), but it can be adjusted to other timeframes as needed.
Interpret the Trend Signals:
A green background indicates a bullish trend, while a red background indicates a bearish trend. The corresponding square shapes above the bars reinforce these signals.
Use the information on the proportion of up and down candles during each trend to gauge the trend's strength and consistency.
Trading Decisions: The indicator can be used in conjunction with other technical analysis tools and indicators to make informed trading decisions. It is particularly useful for identifying trend reversals and potential entry or exit points based on the behavior of higher timeframe order blocks.
Customization and Optimization: Experiment with different higher timeframes and settings to optimize the indicator for your specific trading style and preferences.
Conclusion:
The "OrderBlock Trend (CISD)" indicator offers a comprehensive approach to trend analysis, combining the power of higher timeframe order blocks with clear visual cues and statistical insights. By understanding the underlying concepts and utilizing the provided features, traders can enhance their trend detection and decision-making processes in the markets.
Disclaimer:
This indicator is intended for educational purposes and should be used in conjunction with other analysis methods. Always perform your own research and risk management before making trading decisions.
Some known bugs when you switch to lower timeframe while using daily timeframe data it didn't use the daily candle close to establish the trend change but your current time frame If some of you know how to fix it that would be great if you help me to I would try my best to fix this in the future :) credit to ChatGPT 4o
Breaker Blocks | Flux Charts💎 GENERAL OVERVIEW
Introducing our new Volumized Breaker Blocks indicator! This new indicator can render breaker blocks with their volumetric information. It's highly customizable with detection, invalidation and style settings.
Features of the new Volumized Breaker Block indicator :
Render Bullish & Bearish Breaker Blocks
Enable / Disable Volumetric Information
Enable / Disable Historic Zones
Visual Customizability
📌 HOW DOES IT WORK ?
Breaker blocks form when an order block fails, or "breaks". It is often associated with market going in the opposite direction of the broken order block, and they can be spotted by following order blocks and finding the point they get broken, ie. price goes below a bullish order block.
The volume of a breaker block is simply the total volume of the bar that the original order block is broken.
🚩UNIQUENESS
This indicator can not only detect breaker blocks, but it can also detect them with their volumetric information. Volumetric information can be crucial when considering an breaker block's strength, which can be a crucial form of confluence in certain trading strategies.
⚙️SETTINGS
1. General Configuration
Volumetric Info -> The volumetric information of the Breaker Blocks will be rendered if activated.
Zone Invalidation -> Select between Wick & Close price for Breaker Block Invalidation.
Swing Length -> Swing length is used when finding breaker block formations. Smaller values will result in finding smaller breaker blocks.

Hidden LiquidityHidden Liquidity Indicator: Detecting Breaker Blocks and Hidden Order Blocks (HOBs)
The Hidden Liquidity Indicator is a powerful tool designed to assist traders in identifying breaker blocks and hidden order blocks (HOBs). By analyzing untouched candle bodies within order blocks, it provides a systematic approach to evaluating fair value gaps (FVGs) and order blocks based on engulfing candles.
Features of the Hidden Liquidity Indicator
This indicator effectively differentiates between complete HOBs, partial HOBs and partially mitigated HOBs (PMHOBs), allowing traders to assess market structure with precision. The key classifications include:
HOB (Hidden Order Block): The candle body fully aligns within the FVGs without being touched by wicks, establishing a strong and reliable breaker block.
PMHOB (Partial Mitigated Hidden Order Block) : The candle body is mitigated by less than 50%, making it a weaker version of the Hidden OB.
PHOBs (Partial Hidden Orderblock) : The candle body fits at least by 50% in the FVG making it also weaker than a common HOB
For an HOB to be considered valid, its equilibrium must be crossed by the FVGs, ensuring a focused and high-quality analysis of market structure.
Visualization and Market Structure Analysis
The Hidden Liquidity Indicator utilizes distinct color codes to enhance readability and clarity:
Bullish HOBs – Green
Bearish HOBs – Red
PMHOBs – Orange
PHOBs - Blue
Multi-Timeframe Analysis (MTF)
The indicator is capable of identifying HOBs,PHOBS and PMHOBs across all timeframes. Traders can seamlessly integrate their preferred timeframes by configuring the settings in TradingView.
Settings
You can choose wether you want the indicator to show PHOBs and PMHOBs
Why Use the Hidden Liquidity Indicator?
This indicator provides a structured and precise methodology for analyzing order blocks and breaker blocks. By focusing on untouched candle bodies and equilibrium levels, it offers a unique perspective on market structure that is often overlooked by traditional order block indicators. Its multi-timeframe analysis capability makes it an indispensable tool for traders seeking to refine their market strategy and enhance decision-making.
This guide serves as a comprehensive reference for optimizing the Hidden Liquidity Indicator, enabling traders to leverage its full potential for effective market analys

ICT NY Kill Zone Auto Trading### **ICT NY Kill Zone Auto Trading Strategy (5-Min Chart)**
#### **Overview:**
This strategy is based on Inner Circle Trader (ICT) concepts, focusing on the **New York Kill Zone**. It is designed for trading GBP/USD exclusively on the **5-minute chart**, automatically entering and exiting trades during the US session.
#### **Key Components:**
1. **Time Filter**
- The strategy only operates during the **New York Kill Zone (9:30 AM - 11:00 AM NY Time)**.
- It ensures execution only on the **5-minute timeframe**.
2. **Fair Value Gaps (FVGs) Detection**
- The script identifies areas where price action left an imbalance, known as Fair Value Gaps (FVGs).
- These gaps indicate potential liquidity zones where price may return before continuing in the original direction.
3. **Order Blocks (OBs) Identification**
- **Bullish Order Block:** Occurs when price forms a strong bullish pattern, suggesting further upside movement.
- **Bearish Order Block:** Identified when a strong bearish formation signals potential downside continuation.
4. **Trade Execution**
- **Long Trade:** Entered when a bullish order block forms within the NY Kill Zone and aligns with an FVG.
- **Short Trade:** Entered when a bearish order block forms within the Kill Zone and aligns with an FVG.
5. **Risk Management**
- **Stop Loss:** Fixed at **30 pips** to limit downside risk.
- **Take Profit:** Set at **60 pips**, providing a **2:1 risk-reward ratio**.
6. **Visual Aids**
- The **Kill Zone is highlighted in blue** to help traders visually confirm the active session.
**Objective:**
This script aims to **capitalize on institutional price movements** within the New York session by leveraging ICT concepts such as FVGs and Order Blocks. By automating trade entries and exits, it eliminates emotions and ensures a disciplined trading approach.

ZenAlgo - Heavy DeltaThe ZenAlgo - Heavy Delta indicator is a comprehensive technical analysis tool designed for traders seeking a deeper understanding of market dynamics. It combines multiple advanced sub-indicators, including Order Blocks, Moving Averages, VWAP, and Delta Volume analysis, and more to provide actionable insights. This indicator is particularly useful for identifying potential trade entries and exits based on institutional order flow and price action patterns.
Features
Order Block Detection: Identifies bullish and bearish order blocks with detailed visualization and volume analysis.
VWAP (Volume Weighted Average Price): Tracks the average price of a security weighted by volume over various anchor periods.
Moving Averages (MA): Customizable MAs (13, 21, 50, 200 periods) to detect trends and momentum shifts.
Daily Open and Monday Range: Highlights key levels like daily open and intraday/multi-day high-low ranges for better price context.
Delta Volume Analysis: Measures the net difference between buying and selling volume for market sentiment insights.
Divergence Detection: Detects regular and hidden bullish/bearish divergences for trend reversal opportunities.
Visual Alerts: Displays intuitive symbols for potential buy/sell signals and key price levels.
Added Value: Why Is This Indicator Original/Why Shall You Pay for This Indicator?
The ZenAlgo - Heavy Delta indicator offers a distinct advantage by integrating multiple analysis techniques into one cohesive tool. While many individual indicators are freely available, this script goes beyond simple overlays to provide an advanced analytical framework. Here’s why it stands out:
1. Synergy of Indicators
Order Blocks: These are not static; the indicator dynamically calculates zones where institutional activity likely occurred, supported by volume-weighted metrics.
Delta Volume Analysis: Freely available delta volume tools typically show raw data, but this script filters noise, categorizes volume into meaningful up/down segments, and integrates it with other signals for context.
VWAP and Moving Averages: VWAP and customizable MAs are enhanced with divergence checks, color-coded trends, and market state classifications. This integration helps confirm trends and reversals with higher precision.
2. Volume-Based Insights
Traditional volume indicators often fail to show the "intent" behind price moves. This script combines delta volume and order block data to highlight areas of significant buying or selling pressure and their potential impacts on future price action.
3. Visual Simplicity with Advanced Logic
Unlike using several separate tools, which can clutter your chart, this indicator presents a streamlined interface. Every plotted element serves a clear purpose, minimizing distractions while maximizing actionable insights.
4. Customized for Active Traders
The indicator doesn’t just provide standard calculations. It includes proprietary adjustments like mitigation thresholds in order blocks, percentage-based signals for VWAP, and delta volume intensity levels that align better with active market conditions.
5. Why Pay for It?
Time and effort savings: Instead of setting up and calibrating multiple tools, this indicator combines them into a single efficient package.
Enhanced accuracy: Each sub-indicator validates the others, reducing false signals.
Unique features: For instance, the script automatically adjusts for multi-timeframe inconsistencies and uses gradient color fills to convey volume strength in order blocks—a feature absent in free indicators.
How It Works
The indicator combines individual sub-indicators into a logical framework where each part contributes to the overall analysis. Here’s how each feature operates:
1. Order Blocks
Identification: Uses specific price action patterns to locate zones of likely institutional interest (bullish or bearish blocks).
Dynamic Updates: The blocks adjust as new price data comes in, ensuring their relevance. Volume within these zones is weighted, helping assess their strength and potential price reactions.
Visual Enhancements: Blocks are color-coded and filled with gradients based on volume intensity, providing immediate visual cues about their importance.
2. VWAP (Volume Weighted Average Price)
Calculation: Anchored to user-selected periods (daily, weekly, etc.), VWAP is recalculated in real-time, showing the "fair" price based on traded volume.
Integration: Acts as a dynamic support/resistance line, particularly useful in intraday and swing trading. Labels provide percentage deviation for quick interpretation.
3. Moving Averages (MAs)
Customization: Supports various types (EMA, SMA, etc.) and lengths (13, 21, 50, 200). Traders can configure these to suit their strategies.
Market Status: By comparing the price to these MAs, the indicator classifies the market as Full Bull, Bullish, Neutral, Bearish, or Full Bear. This high-level summary helps traders quickly gauge market sentiment.
4. Delta Volume
Core Logic: Calculates the net difference between buying and selling pressure (volume) for each candle.
Visual Signals: Plots symbols when significant delta volume changes coincide with other indicator signals, like divergence or order block activity.
5. Daily Open and Monday Range
Purpose: Identifies key psychological levels like the daily open and the high/low range for the first trading day of the week.
Context: Highlights these levels with dynamic percentage changes, helping traders understand how price is behaving relative to them.
6. Divergence Detection
Logic: Tracks discrepancies between price movement and momentum (via Moving Averages, Delta Volume, and Order Blocks). These divergences often precede reversals.
Validation: Divergences are only flagged when other features, like delta volume shifts or order block interactions, confirm the setup.
By combining these tools in a meaningful way, ZenAlgo - Heavy Delta transforms raw data into actionable intelligence, giving traders a comprehensive view of market dynamics and a significant edge in decision-making.
Why Use Heikin Ashi for Heavy Delta?
The ZenAlgo - Heavy Delta indicator is optimized for Heikin Ashi (HA) candles, which smooth out market noise and make trends more visually apparent. Heikin Ashi works best for this strategy for several key reasons:
Why Heikin Ashi Works Best
Trend Clarity: Unlike traditional candlesticks, Heikin Ashi averages price data to create smoother transitions. This helps the indicator better identify sustained trends and reduces false signals caused by short-term price fluctuations.
Noise Reduction: HA candles filter out minor fluctuations and emphasize the overall market direction, making it easier to align the indicator’s signals (like Delta Volume and Order Blocks) with larger market movements.
Improved Visual Insights: Features like Order Blocks and Delta Volume align well with Heikin Ashi's smoothed representation, as it avoids the erratic movements that traditional candles sometimes display.
Better Support for Trend Strategies: Heikin Ashi candles naturally highlight key reversals and continuation patterns, which complement the analytical goals of this indicator.
Important Notes About Heikin Ashi:
Synthetic Nature of HA Candles: Heikin Ashi values are calculated differently than traditional candles. For example: a) The open is the average of the prior candle's open and close. b) The close is the average of the high, low, open, and close. This synthetic nature means that HA candles do not reflect actual market prices but rather smoothed averages, which can slightly lag real-time price movements.
Lagging Effect: Because HA candles use averaged data, they can lag behind actual price action. This is beneficial for identifying trends but less effective for precise entry/exit timing.
Inaccuracy in Low Volatility: In low-volume or low-volatility conditions, HA candles may distort actual price dynamics, leading to less reliable insights.
No Direct Alerts or Buy/Sell Signals : Issuing explicit buy or sell signals based on Heikin Ashi candles is not possible due to their averaged, synthetic nature. As such, the ZenAlgo - Heavy Delta indicator does not generate direct trading signals. Instead, the indicator is a decision-support tool that provides insights into trends, volume dynamics, and potential key levels, leaving trade execution to the trader's discretion.
Usage Examples
Trend Confirmation: Use the MA market status to identify if the market is in a Full Bull or Bear state.
Reversal Zones: Monitor order block zones for price rejection or absorption, signaling a potential reversal.
Breakout Trading: Trade breakouts when price surpasses VWAP or Monday Range highs/lows.
Delta Divergence: Look for positive/negative delta volume divergences during consolidations for breakout cues.
Mean Reversion: Use VWAP or MAs as dynamic support/resistance for mean reversion setups.
Intraday Scalping: Utilize daily open and intraday levels for short-term trades.
Swing Trading: Employ order blocks and multi-day ranges to frame swing trade setups.
Volume Climax: Identify volume spikes using Delta Volume to confirm trend continuation or reversal.
Momentum Trading: Combine divergence signals with Delta Volume for high-conviction entries.
Risk Management: Use defined order block boundaries to set stop losses and targets.
Settings
Order Blocks: Customize label visibility, label offsets, and block appearance.
VWAP: Adjust anchor period and toggle visibility.
Moving Averages: Configure length, type (EMA, SMA, etc.), and visibility of MAs (13, 21, 50, 200).
Delta Volume: Enable/disable delta symbols and labels, adjust sensitivity multipliers.
Daily Open/Monday Range: Toggle visibility and customize display preferences.
General Visuals: Adjust label offsets, color schemes, and transparency.
Important Notes
This indicator is a technical analysis tool and does not guarantee trading success.
Use it in conjunction with other indicators and fundamental analysis for a more comprehensive trading strategy.
Performance may vary in low-liquidity markets or during sudden news events.
Divergence signals might fail in strongly trending markets.
ICT Panther (By Obicrypto) V1 ICT Panther Indicator: Full and Detailed Description
The ICT Panther Indicator, created by Obicrypto, is an advanced technical analysis tool designed specifically for traders looking to identify key price action events based on institutional trading techniques, particularly in the context of the Inner Circle Trader (ICT) methodology. This indicator helps traders spot market structure breaks, order blocks, and potential trade opportunities driven by institutional behaviors in the market. Here's a detailed breakdown of its features and how it works:
What Does the ICT Panther Indicator Do?
1. Market Structure Breaks (MSB) Identification:
The ICT Panther identifies critical points where the market changes direction, commonly referred to as a break of structure (BoS). When the price breaks above or below certain key levels (based on highs and lows or opens and closes), it signals a potential shift in market sentiment. These break-of-structure points are essential for traders to determine whether the market is likely to continue its trend or reverse.
2. Order Blocks Visualization:
The indicator plots demand (bullish) and supply (bearish) boxes, which represent areas where institutional traders might place significant buy or sell orders. These zones, known as order blocks, are areas where the price tends to pause or reverse, giving traders key insights into potential entry and exit points. The indicator shows these areas graphically as colored boxes on the chart, which can be used to plan trades based on market structure and price action.
3. Pivot Point Detection:
The ICT Panther identifies important pivot points by tracking higher highs and lower lows. These pivot points are critical in determining the strength of a trend and can help traders confirm the direction of the market. The indicator uses a unique algorithm to detect two levels of pivot points:
- First-Order Pivots: Major pivot points where the price makes notable highs and lows.
- Second-Order Pivots: Smaller pivot points, useful for detecting microtrends within the larger market structure.
4. Bullish and Bearish Break of Structure Lines:
When a significant market structure break (BoS) occurs, the indicator will automatically draw red lines (for bearish break of structure) and green lines (for bullish break of structure) at key price levels. These lines help traders quickly see where institutional moves have occurred in the past and where potential future price moves could originate from.
5. Tested and Filled Boxes:
The ICT Panther also has a built-in mechanism to dim previously tested order blocks. When the price tests an order block (returns to a previous demand or supply zone), the box's color dims to indicate that the area has already been tested, reducing its significance. If the price fully fills an order block, the box stops plotting, providing a clear and clutter-free chart.
Key Features
1. Market Structure Break (MSB) Trigger:
- The indicator allows users to select between highs/lows or opens/closes as the trigger for market structure breaks. This flexibility lets traders adjust the indicator to suit their personal trading style or the behavior of specific assets.
2. Order Block Detection and Visualization:
- The tool automatically plots bullish and bearish demand and supply boxes, representing institutional order blocks on the chart. These boxes provide visual cues for areas of potential price action, where institutional traders might be active.
3. Second-Order Pivot Highlighting:
- The ICT Panther offers an option to plot second-order pivots, highlighting smaller pivot points within the larger market structure. These pivots can be helpful for short-term traders who need to react to smaller price movements while still keeping the larger trend in mind.
4. Box Test and Fill Delays:
- Users can configure delays for box tests and box fills, meaning the indicator will only mark a box as tested or filled after a certain number of bars. This prevents false signals and helps confirm that a zone is truly significant in the market.
5. Customization and Visual Clarity:
- The indicator is highly customizable, allowing users to turn on or off various features like:
- Displaying second-order pivots.
- Highlighting candles that broke structure.
- Plotting market structure broke lines.
- Showing or hiding tested and filled demand boxes.
- Setting custom delays for box testing and filling to suit different market conditions.
6. Tested and Filled Order Block Visualization:
- The indicator visually adjusts the tested and filled order blocks, dimming tested zones and removing filled zones to avoid clutter on the chart. This ensures that traders can focus on active trading opportunities without distractions from historical data.
How Does It Work?
1. Detecting Market Structure Breaks (BoS):
- The indicator continuously tracks the market for key price action signals. When the price breaks through previous highs or lows (or opens and closes, depending on your selection), the indicator marks this as a break of structure. This is a critical signal used by institutional traders and retail traders alike to determine potential future price movements.
2. Order Block Identification:
- Whenever a bullish break of structure occurs, the indicator plots a green demand box to show the area where institutional buyers might have placed significant orders. Similarly, for a bearish break of structure, it plots a red supply box representing areas where institutional sellers are active.
3. Pivot Analysis and Tracking:
- As the market moves, the indicator continuously updates first-order and second-order pivot points based on highs and lows. These points help traders identify whether the market is trending or consolidating. Traders can use these pivot points in combination with the order blocks to make informed trading decisions.
4. Box Testing and Filling:
- When the price retests an existing order block, the box dims to show it has been tested. If the price fully fills the box, it is no longer shown, which helps traders focus on the most relevant, untested order blocks.
Benefits for Traders
- Improved Decision-Making: With clear visuals and advanced logic based on institutional trading strategies, this indicator provides a deeper understanding of market structure and price action.
- Reduced Clutter: The indicator intelligently manages the display of order blocks and pivot points, ensuring that traders focus only on the most relevant information.
- Adaptability: Whether you are a swing trader or a day trader, the ICT Panther can be adjusted to fit your trading style, offering robust and flexible tools for tracking market structure and order blocks.
- Institutional Edge: By identifying institutional-level order blocks and market structure breaks, traders using this indicator can trade in line with the strategies of large market participants.
Who Should Use the ICT Panther Indicator?
This indicator is ideal for:
- Crypto, Forex, and Stock Traders who want to incorporate institutional trading concepts into their strategies.
- Technical Analysts looking for precise tools to measure the market structure and price action.
- ICT Traders who follow the Inner Circle Trader methodology and want an advanced tool to automate and enhance their analysis.
- Price Action Traders seeking a reliable indicator to track pivot points, order blocks, and market structure breaks.
The ICT Panther Indicator is a powerful, versatile tool that brings institutional trading techniques to the fingertips of retail traders. Whether you are looking to identify key market structure breaks, order blocks, or crucial pivot points, this indicator offers detailed visualizations and customizable options to help you make more informed trading decisions. With its ability to track the activities of institutional traders, the ICT Panther Indicator equips traders with the insights needed to stay ahead of the market and trade with confidence.
With the ICT Panther Indicator, traders can follow the movements of institutional money, making it easier to predict market direction and capitalize on high-probability trading opportunities.
Enjoy it and share it with your friends!

Unicorn ICT Signals [TradingFinder] Breaker Block + FVG Zones🔵 Introduction
The "ICT Unicorn Model" trading strategy in the "Inner Circle Trader" (ICT) style is one of the well-known strategies in the world of Forex and financial market trading.
The ICT methodology was developed by Michael Huddleston and is based on technical analysis and Price Action concepts.
This style focuses specifically on interpreting price movements and identifying optimal entry and exit points in the market.
In the Unicorn strategy, traders seek points where the probability of price reversal or trend continuation is high. This strategy is primarily based on recognizing and analyzing Price Action patterns and market structure.
By understanding"ICT Unicorn Model", traders can make more informed decisions about where to enter or exit trades, thereby increasing their chances of success in the market.
🟣 Understanding the Breaker Block
A Breaker Block is a specialized form of an Order Block that changes its role after a key market level is broken. Typically, an Order Block is an area on the chart where large institutional orders are likely to be placed, providing strong support or resistance.
However, when this area is breached, and the price moves in the opposite direction, it transforms into what is known as a Breaker Block. This shift indicates a reversal in market sentiment, turning the previous support into resistance or vice versa, thereby signaling a potential trend change to traders.
🟣 The Significance of the Fair Value Gap (FVG)
The Fair Value Gap (FVG) refers to an area on a price chart where the price rapidly moves through a level, leaving behind a gap. This gap represents an imbalance between supply and demand and is often seen as a potential area for price to return and fill the gap.
These zones are crucial for traders as they can indicate future price movements, providing opportunities to enter or exit trades.
🟣 Defining the ICT Unicorn Model
When an FVG overlaps with a Breaker Block, it forms a highly significant trading area known as a Unicorn. This overlap creates an ideal zone for traders to enter the market, as it combines two powerful technical signals.
The Unicorn Model is therefore considered an optimal strategy for identifying precise entry and exit points in the financial markets.
Demand ICT Unicorn Model :
Supply ICT Unicorn Model :
🔵 How to Use
🟣 Bullish ICT Unicorn
The Bullish ICT Unicorn model is applicable when the market is in an uptrend, and traders are seeking buying opportunities.
Follow these steps to identify Bullish ICT Unicorn :
Identify the Bullish Breaker Block : Locate an area where the price moved upward after breaking an Order Block. This area now acts as a Breaker Block.
Identify the Bullish FVG : Look for a Fair Value Gap near the Breaker Block.
Confirm the Unicorn : When the Bullish Breaker Block and Bullish FVG overlap, a Bullish Unicorn is confirmed. Traders can enter a buy position when the price returns to this zone.
🟣Bearish ICT Unicorn
The Bearish ICT Unicorn model is used when the market is in a downtrend, and traders are looking for selling opportunities.
To identify Bearish ICT Unicorn, follow these steps :
Identify the Bearish Breaker Block : Find an area where the price moved downward after breaking an Order Block. This area now acts as a Breaker Block.
Identify the Bearish FVG : Check if a Fair Value Gap has formed near the Breaker Block.
Confirm the Unicorn : When the Bearish Breaker Block and Bearish FVG overlap, a Bearish Unicorn is confirmed. Traders can enter a sell position when the price returns to this zone.
🔵 Setting
🟣 Global Setting
Pivot Period of Order Blocks Detector : Enter the desired pivot period to identify the Order Block.
Order Block Validity Period (Bar) : You can specify the maximum time the Order Block remains valid based on the number of candles from the origin.
Mitigation Level Breaker Block : Determining the basic level of a Breaker Block. When the price hits the basic level, the Breaker Block due to mitigation.
Mitigation Level FVG : Determining the basic level of a FVG. When the price hits the basic level, the FVG due to mitigation.
Mitigation Level Unicorn : Determining the basic level of a Unicorn Block. When the price hits the basic level, the Unicorn Block due to mitigation.
🟣 Unicorn Block Display
Show All Unicorn Block : If it is turned off, only the last Order Block will be displayed.
Demand Unicorn Block : Show or not show and specify color.
Supply Unicorn Block : Show or not show and specify color.
🟣 Breaker Block Display
Show All Breaker Block : If it is turned off, only the last Breaker Block will be displayed.
Demand Main Breaker Block : Show or not show and specify color.
Demand Sub (Propulsion & BoS Origin) Breaker Block : Show or not show and specify color.
Supply Main Breaker Block : Show or not show and specify color.
Supply Sub (Propulsion & BoS Origin) Breaker Block : Show or not show and specify color.
🟣 Fair Value Gap Display
Show Bullish FVG : Toggles the display of demand-related boxes.
Show Bearish FVG : Toggles the display of supply-related boxes.
🟣 Logic Settings
🟣 Order Block Refinement
Refine Order Blocks : Enable or disable the refinement feature. Mode selection.
🟣 FVG Filter
FVG Filter : This refines the number of identified FVG areas based on a specified algorithm to focus on higher quality signals and reduce noise.
Types of FVG filters :
Very Aggressive Filter: Adds a condition where, for an upward FVG, the last candle's highest price must exceed the middle candle's highest price, and for a downward FVG, the last candle's lowest price must be lower than the middle candle's lowest price. This minimally filters out FVGs.
Aggressive Filter: Builds on the Very Aggressive mode by ensuring the middle candle is not too small, filtering out more FVGs.
Defensive Filter: Adds criteria regarding the size and structure of the middle candle, requiring it to have a substantial body and specific polarity conditions, filtering out a significant number of FVGs.
Very Defensive Filter: Further refines filtering by ensuring the first and third candles are not small-bodied doji candles, retaining only the highest quality signals.
🟣 Alert
Alert Name : The name of the alert you receive.
Alert ICT Unicorn Model Block Mitigation :
On / Off
Message Frequency :
This string parameter defines the announcement frequency. Choices include: "All" (activates the alert every time the function is called), "Once Per Bar" (activates the alert only on the first call within the bar), and "Once Per Bar Close" (the alert is activated only by a call at the last script execution of the real-time bar upon closing). The default setting is "Once per Bar".
Show Alert Time by Time Zone :
The date, hour, and minute you receive in alert messages can be based on any time zone you choose. For example, if you want New York time, you should enter "UTC-4". This input is set to the time zone "UTC" by default.
🔵Conclusion
The Unicorn Model in ICT, utilizing the concepts of Breaker Blocks and Fair Value Gaps, provides an effective tool for identifying entry and exit points in financial markets. By offering more precise signals, this model helps traders make better decisions and minimize trading risks.
Success in applying this model requires practice and a deep understanding of market structure, but it can significantly improve trading performance.
